Oracle has confirmed a bug related to the deployment of security with a planning application maintained in EPMA in version 11.1.2.x. When the Shared Members checkbox is selected in an EPMA deployment of a Planning application, it ignores this option. Even if the Shared Members box is checked, the user still only gets access to Ohio Region, and not the children, in the example below. Oracle is currently working on a patch. Read more
The introduction of Hyperion 11.1.2 has some fantastic improvements. Many of these have been long awaited. The next few articles on In2Hyperion will describe some of the enhancements to Hyperion Planning, Hyperion Essbase, and Hyperion SmartView.
XREF Background
If you have been developing Planning applications, you are probably very familiar with the XREF function. This function is used in business rules, calculation scripts, and member formulas. It provides a method to move data from one plan type (Essbase database) to another plan type. It is executed from the target database and pulls the data from the source. XWRITE was actually introduced in later versions of 11.1.1.x, but is very stable in 11.1.2.x. XWRITE is executed from the source and pushes data to the target. This function is a huge improvement over XREF. Read more
Although implied shares can improve performance by not storing the same data multiple times, it has many negative impacts. For example, implied shares cause problems in Hyperion Planning at the load level (level 0). A parent with a storage property of Stored that has one child (or only one child that consolidates) will create an implied share. This results in level 0 members being locked, preventing web form data entry. In Essbase/Planning, the storage method of any parent with one child has to be changed to Never Share to allow user input.
For those of you who have been snake bitten by this, you will welcome a relatively unknown Essbase configuration setting in the Essbase configuration file (essbase.cfg). Read more
KScope12 is the premier conference for Hyperion techies and up-and-comers. Whether you are looking to brush up on your skills, learn new skills, or see how others overcome challenges, you will want to participate in this event. If your organization values your development and has a budget for these growth opportunities, mark your calendar for June 24th through the 28th. Registration is open, and as more information is available, it will be published at In2Hyperion.
Presenting a topic is a great way to reduce the cost of the trip. It’s a great way to get your name out in the community as well. If you have something that you think would be valuable for other experts to hear about, submit an abstract.
We hope to see you there. Visit www.kscope12.com for all travel details and abstract submissions.
When developing it’s always best to avoid “recreating the wheel” and the same concept applies when building reports in Hyperion Financial Reporting. An important step in the design phase centers on report row and column sets; these are simply the groups of members which display in the rows and columns of each report. Any reports that “share” groups of members, whether in rows or columns, provide an excellent opportunity for creating Hyperion Row and/or Column Templates. These templates can then be referenced in additional reports, resulting in decreased development effort and less maintenance.
Benefits: When needing to create multiple reports which have similar or identical row and column sets, the user can save time by creating one standardized row and column set, saving it as an object in the repository, and reusing it for multiple reports. The user also has the ability to modify a row/column template at any point and resave it into the repository which automatically updates all grids linked to the template. Read more
Goodbye to the days of JavaScript in order to enforce data input policies and rules to Planning web forms. With Planning version 11.1.2 and newer, Oracle has introduced a powerful set of tools for data validation within the Planning Data Form Designer itself. Let’s walk through a scenario of how this works.
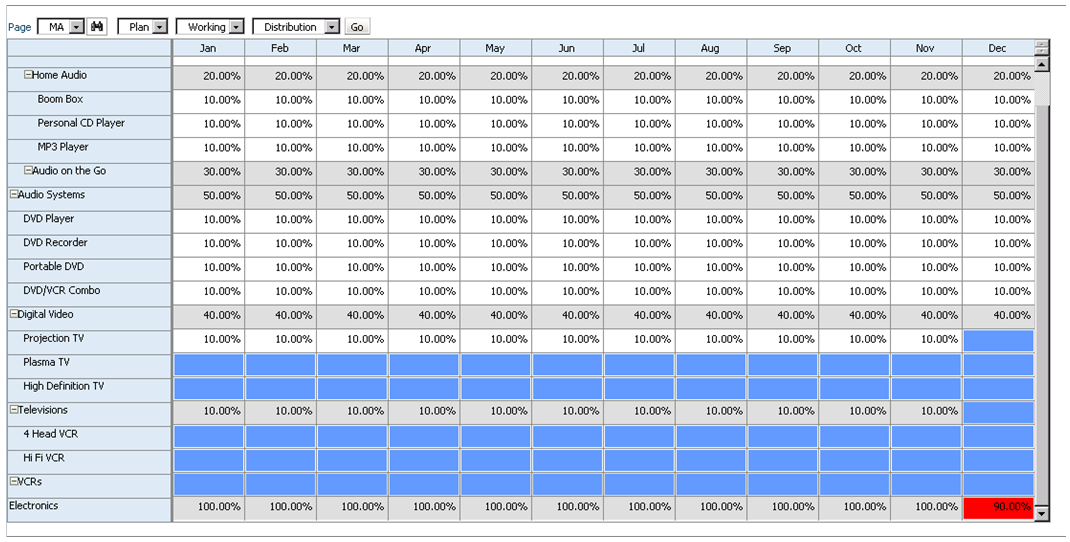
Say that we have a product mix form that will be used to input percentages as drivers for a revenue allocation. Here’s what the form looks like:
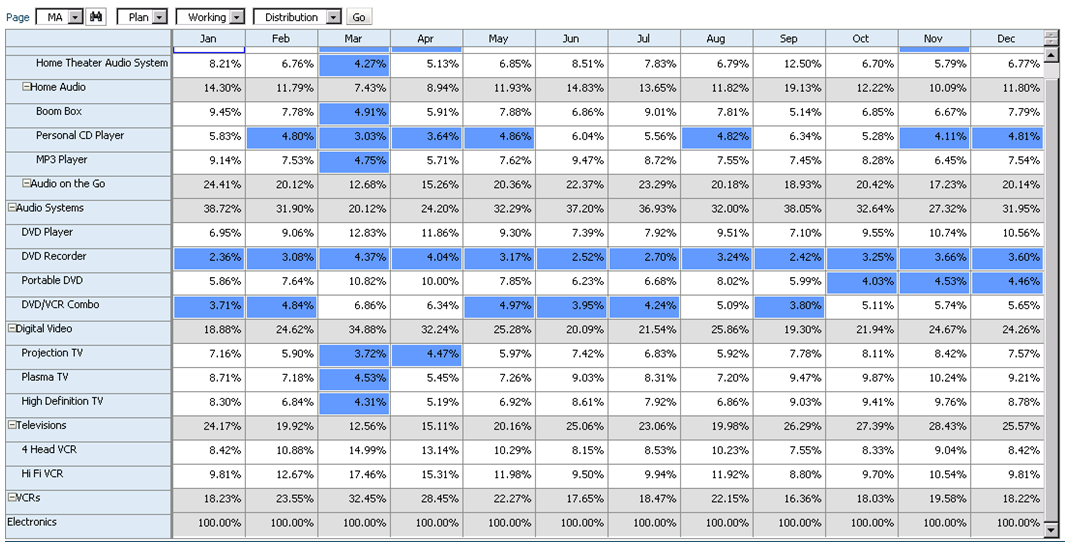
We should expect that the sum of these percentages to be 100% at the “Electronics” parent member. If this is not the case, the revenue allocation will incorrectly allocate data across products. So how do we enforce this rule? Simple… let’s take a look at the data form design.
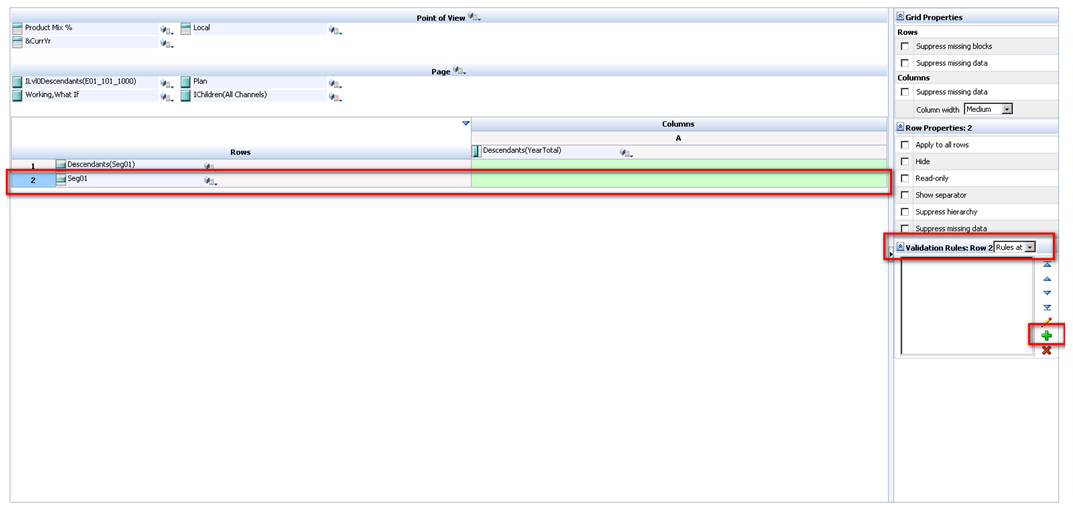
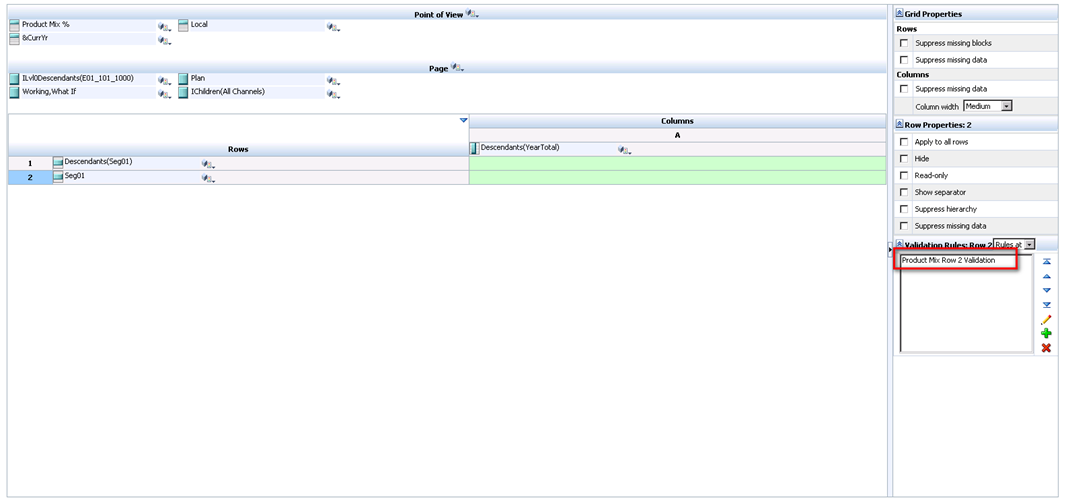
As a row definition we’ve included two member selections; 1) Descendants(Seg01) or Descendants(Electronics) and 2) Seg01 or Electronics. We are going to add a validation rule to row 2 of the data form. To do this, highlight row 2 and click the sign to add a new validation rule. Notice that in the validation rules section, it now says ‘Validation Rules: Row 2’.
The Data Validation Rule Builder will then be launched. Let’s fill in the rule. We should ensure the Location is set to ‘Row 2’. We’ve filled in a name and quick description, then ensured that the ‘Enable validation rule’ check box is checked.
For the rule we’ve defined some simple if logic:
IF [Current Cell Value] != [Value = 1] THEN [Process Cell] ;
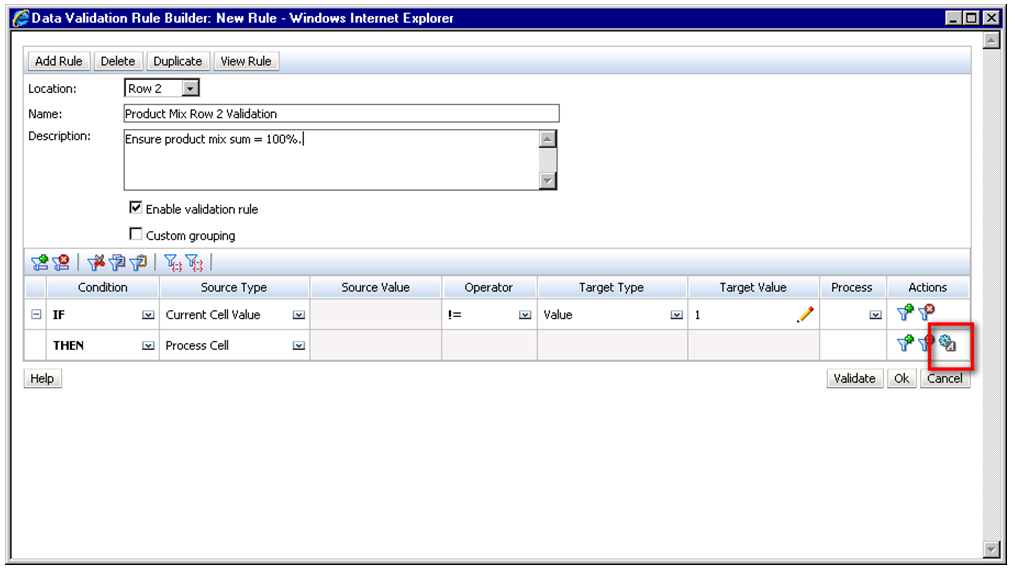
To define what occurs if this condition is met we choose the ‘Process Cell’ action defined by the small gear with a letter A next to it. Here we will highlight the cell red and notify the user with a validation message.
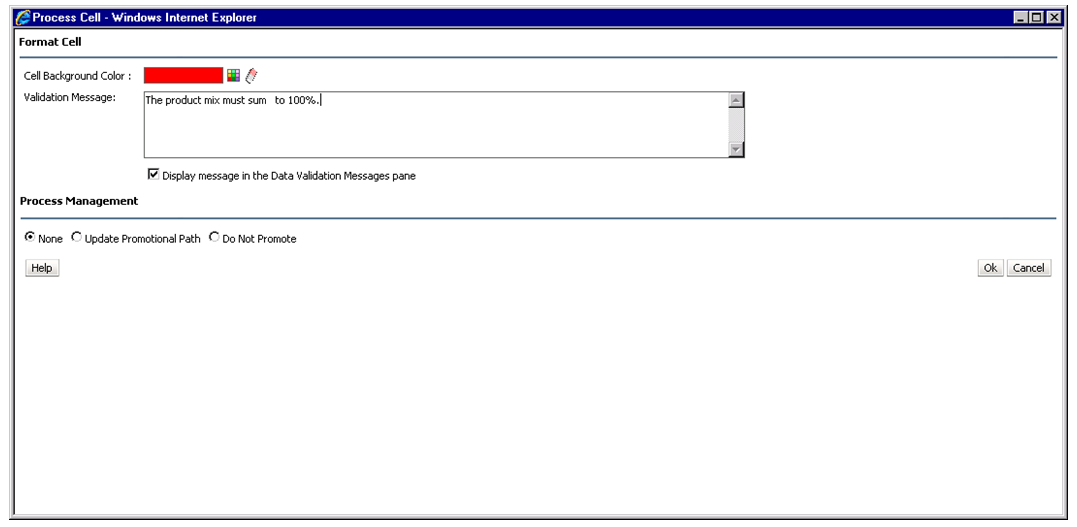
We click through to save the Process Cell definition and the Validation Rule itself and should now see the rule in the data form definition.
So let’s take a look at how the end user will interact with this form. Percentages are entered by product for each month. Upon save, notice that all months for Electronics that equal 100% appear normal. December only sums to 90% and is highlighted in red as we specified in the data validation rule. We cannot limit the user’s ability to save the form until the cell equals 100%; we can only notify them of the issue, and explain the cause and potential resolutions.
Of course, this is a simple example of what can be done using Planning’s Data Validation Rules. The possibilities are endless. Oracle has more scenario walkthroughs in the Planning Administrator’s Guide. View them here: http://download.oracle.com/docs/cd/E17236_01/epm.1112/hp_admin/ch08.html
The format of the data that is loaded to Essbase is often an after-thought. But, should it be? When requesting the data file from a source system, it is more important than you may think to have it sorted to mirror your outline.
Assume an outline has the following dimensions.
- Period [DENSE]
- Account [DENSE]
- Region [SPARSE]
- Category [SPARSE]
- Product [SPARSE]
- Organization [SPARSE]
The most efficient way to receive a data file would be to have it sorted by Organization, Product, Category, Region, and then Account. Data files load faster when the columns that hold the sparse members are sorted in reverse order of the sparse dimensions that exist in the outline.
The reason the data loads faster is because it opens a block of data only one time. If the data was sorted by the dense members first, then every block would have to be opened multiple times. If the same sparse member combinations have 3,000 dense members with data, the block would be opened up to 3,000 times.
There are some more important benefits of doing this, however. When the block is opened multiple times, the database becomes far more fragmented than it needs to be. Fragmentation causes calculations to be slower and retrieving data can also be impacted, which can lead to frustrated customers.
By not sorting the data when loaded, every time a data load occurs, any performance issues that may exist are exacerbated. So, anytime possible, sort the data load files by the last sparse dimension in the outline, the second to last sparse dimension in the outline, and so on. You may be presently surprised at the benefits.
Everybody knows the quickest way from point A to point B is a straight line. Everybody assumes that the path is traveled only one time – not back and forth, over and over again. I see a lot of Essbase calculations and business rules, from experienced and novice developers, that go from point A to point B taking a straight line. But, the calculation travels that line multiple times and is terribly inefficient.
Here is a simple example of a calculation. Assume the Account dimension is dense, and the following members are all members in the Account dimension. We will also assume there is a reason to store these values rather than making them dynamic calc member formulas. Most of these are embedded in a FIX statement so the calculation only executes on the appropriate blocks. To minimize confusion, this will not be added to the example.
Average Balance = (Beginning Balance  Ending Balance)  / 2;
Average Headcount = (Beginning Headcount   Ending Headcount) / 2;
Salaries = Average Headcount * Average Salaries;
Taxes = Gross Income * Tax Rate;
One of the staples of writing an effective calculation is to minimize the number of times a single block is opened, updated, and closed. Think of a block as a spreadsheet, with accounts in the rows, and the periods in the columns. If 100 spreadsheets had to be updated, the most efficient way to update them would be to open one, update the four accounts above, then save and close the spreadsheet (rather than opening/editing/closing each spreadsheet 4 different times for each account).
I will preface by stating the following can respond differently in different version. The 11.1.x admin guide specifically states the following is not accurate. Due to the inconsistencies I have experienced, I always play it safe and assume the following regardless of the version.
You might be surprised to know that the example above passes through every block four times. First, it will pass through all the blocks and calculate Average Balance. It will then go back and pass through the same blocks again, calculating Average Headcount. This will occur two more times for Salaries and Taxes. This is, theoretically, almost 4 times slower than passing through the blocks once.
The solution is very simple. Simply place parenthesis around the calculations.
(
Average Balance = (Beginning Balance  Ending Balance)  / 2;
Average Headcount = (Beginning Headcount   Ending Headcount) / 2;
Salaries = Average Headcount * Average Salaries;
Taxes = Gross Income * Tax Rate;
)
This will force all four accounts to be calculated at the same time. The block will be opened, all four accounts will be calculated and the block will be saved.
If you are new to this concept, you probably have done this without even knowing you were doing it. When an IF statement is written, what follows the anchor? An open parenthesis. And, the ENDIF is followed by a close parenthesis. There is your block!
"East"
(IF(@ISMBR("East"))
    "East" = "East" * 1.1;
ENDIF)
I have seen this very simple change drastically improve calculations. Go back to a calculation that can use blocks and test it. I bet you will be very pleased with the improvement.
Working with people new to Essbase every three to six months, I am always looking for ways to show users their hierarchies effectively. Many of them don’t have access to Essbase administration services or EPMA. So, I always fall back to excel as a distribution method, as well as documentation, to show hierarchies.
Expanding hierarchies to all descendants is a great way to show small hierarchies, but, I am always asked to make it a collapsible hierarchy using the Excel grouping feature. The challenge of doing this manually to a hierarchy with thousands of members is that it is extremely time consuming and very error prone.
The following script can be added to any workbook to automate this effort.
Sub CreateOutline()
    Dim cell As Range
    Dim iCount As Integer
    For Each cell In Selection
        'Check the number of spaces in front of the member name
        'and divide by 5 (one level)
        iCount = (Len(cell.Value) - Len(Trim(cell.Value))) / 5
        'Only execute if the row is indented
        If iCount <> 0 Then cell.EntireRow.OutlineLevel = iCount
    Next cell
    MsgBox "Completed"
End Sub
Setup
First, this sub routine has to be added to a workbook. Open up the visual basic editor. Right click on the workbook in the project explorer window and add a new module. Paste the code above in the new module. The editor is in different places in different version. In Excel 2007 and 2010, the Developer ribbon is not visible by default. To make it visible, go to the navigator wheel and click Excel Options. There is a checkbox named Show Developer Ribbon that will make this developer ribbon viewable.
How To Use
First, open the member selection option in the Essbase add-in or smart view and select the parent. Add all its descendants. Alternately, change the drill type to all descendants and zoom in on the member of the hierarchy.
Retrieve, or refresh, the data, and make sure the indent is set so the children are indented. Now, highlight the range of cells that has the hierarchy/dimension that the grouping should be applied. This should include cells in one column of the worksheet. Open the code editor and place the cursor inside the sub routine you added from above and click the green play triangle in the toolbar to execute the script. When this is finished, go back to the worksheet with the hierarchy and it will have the hierarchy grouped.
Excel limits the level of groupings to eight. If the hierarchy has more than eight levels, they will be ignored. Now, the hierarchy can be expanded and collapsed for viewing.
Shortcut keys or toolbar buttons can be assigned to execute this function if it is used frequently. If you are interested in doing this, there are a plethora of how-to articles on this topic. This Google search will get you started if you choose to go down that path.
So, the next time you need to explain a hierarchy in Essbase, or distribute it in a common format, hopefully this script will help.
A lot of users like to see hierarchies in Excel and build groupings around these hierarchies so they can be collapsed and expanded easily. It is not a huge deal to do this for things that don’t change a lot, like months rolling to a quarter, but it can be extremely cumbersome to maintain for organizational or account hierarchies that are large or change frequently.
By adding some VBA code (a macro) to your workbook, managing groupings can be completely automated. This can be customized for a plethora of different scenarios. Below are 2 examples that Hyperion users will encounter. One caveat to this is that Excel limits the number of grouping levels to 8. If the worksheet has more than 8 levels, the following logic would not provide the expected result.
Creating a Hierarchy Based On Excel Indents
If a spreadsheet exists where the hierarchy is created with the indent (not multiple columns) feature of Excel, select the range for the groupings to be applied. Execute the following script. Basically, this loops through the cells you have selected and will create the groupings based on the number of indents in the cell.
Sub CreateGroupingsOnIndents()

Dim cell As Range
For Each cell In Selection
    If cell.IndentLevel <> 0 Then
        cell.EntireRow.OutlineLevel = cell.IndentLevel
    Else
        cell.EntireRow.ClearOutline
    End If
Next

End Sub
Creating a Hierarchy Based On SmartView/Excel Add-In Indents
When retrieving from Essbase, cells are indented by adding 5 spaces to the member name. By getting the length of the cell, subtracting the number of spaces preceding the member name, and dividing the result by 5, the level of the indent is identified. Select the cells with the member names and execute the following.
Sub CreateGroupingsOnSpaces()

Dim cell As Range
Dim iLength1 As Integer
Dim iLength2 As Integer
Dim iIndent As Integer

For Each cell In Selection
    iLength1 = Len(cell.Value)
    iLength2 = Len(LTrim(cell.Value))
    iIndent = (iLength1 - iLength2) / 5
    If iIndent <> 0 Then
        cell.EntireRow.OutlineLevel = iIndent
    Else
        cell.EntireRow.ClearOutline
    End If
Next

End Sub
Setup a Module
If you are unfamiliar with adding custom code to an Excel workbook, follow the steps below.
Excel 2000 and below
- Select Tools/Macro/Visual Basic Editor
- Right click on the workbook in the Project window, and select Insert/Module
- Expand the module folder and open the new module (likely module1)
- Paste the example above in this window to the right
- Execute it by clicking F5 or the green play triangle in the toolbar
Excel 2003 and greater
- Select the Navigation Wheel, and check the “Show Developer tab in the Ribbon” checkbox in the Popular tab
- Select the Developer Ribbon and click Visual Basic
- Right click on the workbook in the Project window, and select Insert/Module
- Expand the module folder and open the new module (likely module1)
- Paste the example above in this window to the right
- Execute it by clicking F5 or the green play triangle in the toolbar
These can also be associated to a custom menu or toolbar if you choose to take the extra step!