Reporting solutions often require companies to filter out a top range of Key Performance Indicators; for example, the top 10 expenses related to marketing. Hyperion Financial Reporting makes this type of reporting easy for developers by providing the “Top” properties checkbox. The difficulty arises when a company requires a solution to display the bottom 10 – those 10 expenses that account for a majority of marketing related expense. Hyperion Financial Reporting has nothing built to provide this type of information.
As you might expect – knowing your smaller expenses is important but knowing the largest; those where you can improve margin, is vital. A solution to display the bottom 10 is detailed below; this solution displays the 10 largest negative values vs. displaying the 10 largest positive values.
The high-level solution includes the following functionality:
a. Inserting a “Rank” column.
b. Sorting on the “Rank” column.
c. Adding conditional suppression for bottom 10.
Step 1:
Create a report grid with a formula column as the first column (Column A below).

Step 2:
Insert the “Rank” function on the Formula Column. Be sure to choose the “Ascending” property. Adding “Rank” will order the rows from High-to-Low based on the data returned. The example below provides ranking off of Column ‘A’. The ranking is used on Step 4 when adding conditional suppression.

Step 3:
Apply row “Sort” to the grid. You find the “Sort” property by placing focus on the entire grid (left clicking the upper left-most cell). Choose to apply sorting to the “Rows”, Sort by “Column A”, and sort in “Ascending” order. Sorting will determine the order in which the data is displayed, Ascending or Descending. The Sorting is used on Step 4 when adding conditional suppression.

Step 4:
Add Conditional Suppression to the row(s). This logic will determine which data rows are ultimately displayed to the user. To add conditional suppression, highlight the row and click “Advanced Options”. Because the requirement is to show the bottom 10, suppression should hide any row with a “Rank” value greater than 10 (You will also want to suppress rows where “No Data” is returned).
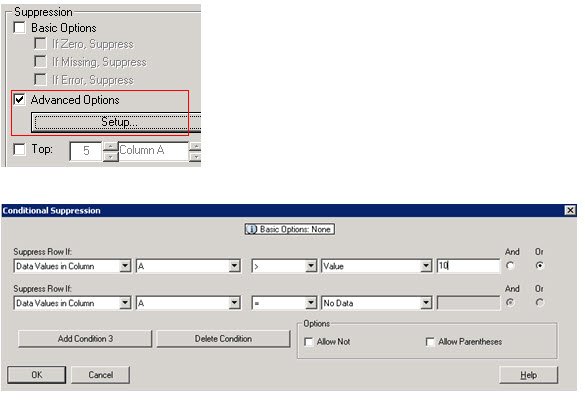
When this report is run, only the bottom 10 will be displayed to the user… those marketing expenses with the largest negative values. The solution above will essentially do what a “Bottom” checkbox would have provided had Hyperion programmed this functionality into the application.