Adventures in Groovy – Part 47: Real World Wins, Part 1

A specialty chemical products company created an ASO reporting cube in ePBCS. This application housed detailed data that rolled up to a GL account. The problem was the source didn’t always tie to the GL due to restatements, GL entries, and manual corrections. Since they wanted the data to match to the book of record, but still have the level of reporting at the detailed level, they wanted to load data from both systems, calculate the variance, and store that variance so users would see the difference between the two sources.
There were a number of challenges. Procedural calculations were “too complex” and could not calculate at all the levels. They didn’t want to engineer a new solution that included a BSO calculation where the data was replicated and calculated. So, Groovy was selected to calculate the variance.
Dimension Explanation
To simplify the explanation, this following Smart View retrieve will help tell the story.
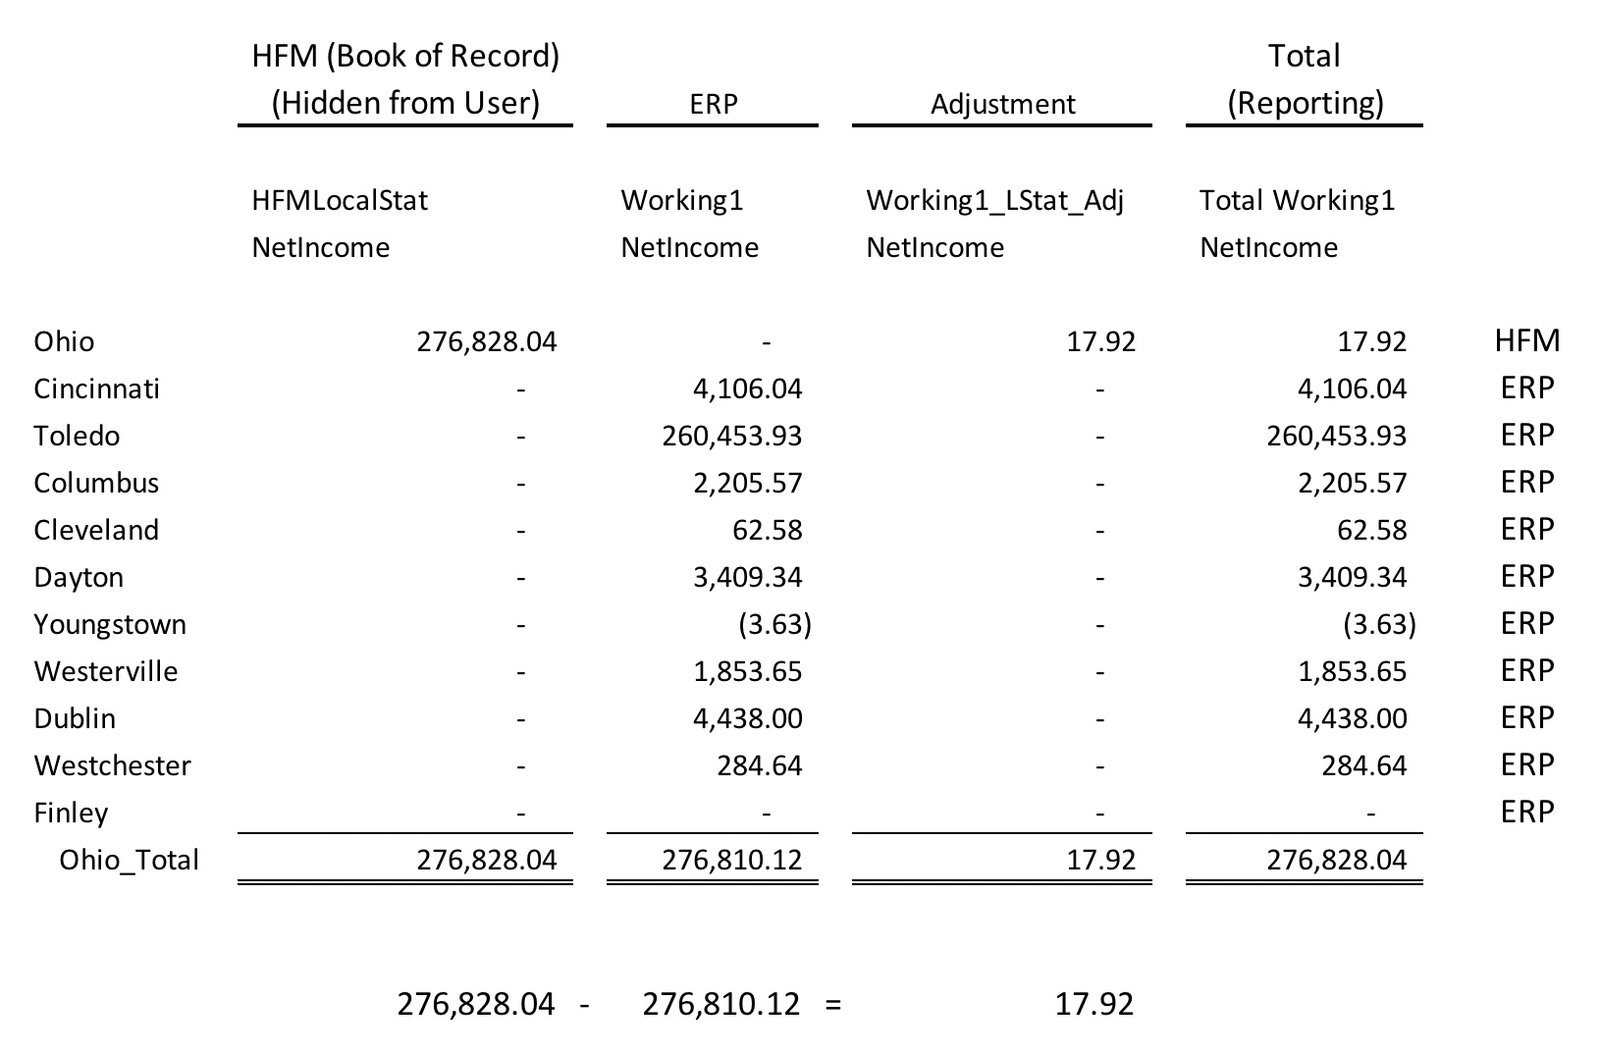
Organization dimension includes sub organizations from the ERP, as well as the official organization in HFM. If Ohio was an organization in HFM, the hierarchy would look similar to this.
- Ohio_Total
- Ohio
- Cincinnati
- Columbus
- Cleveland
I would have preferred to use a source dimension for this, but the application didn’t include one. So, we used version, and it look like this.
- Total Working
- Working (where the actuals were loaded) – named working1 in the script below
- Working Adjustment (where the adjustment to get back to the book of record was stored) – named Working1_LStat_Adj in the script below
- System Versions (hidden from users)
- HFM Stat (where HFM was loaded) – named HFMLocalStat in the script below
Groovy Calculation Overview
The calculation prompted the user for a start and end month, and the year. The follow was done at the bottom of every other dimension in the application.
- The first piece of the calculation queried the Org hierarchy and found all the level 1 members that ended in _Total (Ohio_Total in the example above). These were stored in an array to be used later.
- The second step was to retrieve the data from HFM (HFMLocalStat) and the data loaded from the ERP (Working1) at level 1.
- The third step was to calculate the variance between x_Total member for the ERP and HFM data and store it at the HFM child member in Working1_LStat_Adj.
- The last step was to submit the results
The application didn’t have a source dimension, which is normally where I would account for this, so we added a few additional versions. The first was a statistical version that was only used to house the data imported. Users didn’t have access to this version. The GL data was loaded to a statistical version. The working version was compared to the statistical version, and the difference was stored in working adjustments. The two of these combined was used to report from
Groovy Calculation Deep Dive
The calculation would skip the months that had no data. For 12 months, the calculation finished in less than 5 minutes. The calculation was designed, built, system tested, and went through user validation in a few days. The total development time was less than a day. The administrators could use the existing architecture with no changes required (outside of creating a new member in the xxx dimension)
[membership level=”0″]
In2Hyperion has premium content that is only available to those who make a small annual donation.
|
Already have an account with |
Want to purchase a subscription to |
[/membership]
[membership]
/*RTPS: {rtpMonth} {rtpYear} */
def rtpMonth = rtps.rtpMonth.getEnteredValue()
def rtpYear = rtps.rtpYear.getEssbaseValue().replaceAll('"', '')

def lastMonth = Calendar.instance.with {
time = new Date().parse("MMM", rtps.rtpMonth.getEnteredValue() )
it[ MONTH ]
}

// Setup connections
Cube cube = operation.application.getCube("Operations")

// Identify the orgs that are taken into account and need adjusted
// members with a parent equal to the child with a _Total suffix
Dimension orgDim = operation.application.getDimension("Org", cube)
def keyProp = "Parent"
def orgParentChild = [:]
def Orgs = orgDim.getEvaluatedMembers("ILvl0Descendants(All Org)", cube) as String[]
Orgs.each{
  Member orgMbr = orgDim.getMember(it)
  def memberProps = orgMbr.toMap()
  if(memberProps[keyProp] == it.toString() + "_Total"){
    orgParentChild[it] = it.toString() + "_Total"
  }
}
def orgParents = orgParentChild.collect{it.value}

// Loop through months selected
(0..lastMonth).each{ iMonth ->
  def runMonth = new java.text.DateFormatSymbols().months[iMonth]
  def runDay = "${iMonth+1}-1"
  println "Executing for ${runMonth}"

  // retrieve the ERP and HFM data points
  DataGridDefinitionBuilder EntityBuilder = cube.dataGridDefinitionBuilder()
  EntityBuilder.addPov(['Market','Project','Scenario','View','Years','Currency','Product','BT_Customer','Customer'],
                       [['Total_Market'],['Total Project'],['Actual'],['PTD'],[rtpYear],['USD'],['Total Product'],['BT_Customer'],['TotalCustomer']])
  EntityBuilder.addColumn(['Period','Version'], [[runMonth] , ['Working1','HFMLocalStat','Working1_LStat_Adj']])
  EntityBuilder.addRow(['Entity','Org','Account'], [ ['ILvl0Descendants("Total Entity")'],orgParents,['ILvl0Descendants("NetIncome")'] ])
  EntityBuilder.setSuppressMissingBlocks(true)
  DataGridDefinition EntityDefinition = EntityBuilder.build()

  // Calculate and submit the adjustments
  // Build the grid based on the rows in the previous grid
  cube.loadGrid(EntityDefinition, false).withCloseable { entityGrid ->
    if(entityGrid.size() > 0){
      DataGridBuilder builderSubmit = cube.dataGridBuilder("MM/DD/YYYY")
      builderSubmit.addPov('No Market','No Project','Actual','PTD',rtpYear,'USD','No Product','BT_No Customer','No Customer','Working1_LStat_Adj')
      builderSubmit.addColumn(runDay)
      entityGrid.dataCellIterator("Working1").each{ it ->
        builderSubmit.addRow([it.getMemberName("Entity"), it.getMemberName("Org").toString().reverse().drop(6).reverse(), it.getMemberName("Account")], [it.crossDimCell("HFMLocalStat").data - it.data])// it.crossDimCell("HFMLocalStat").data
      }
      DataGridBuilder.Status status = new DataGridBuilder.Status()
      DataGrid gridx = builderSubmit.build(status)
      cube.saveGrid(gridx)
      println(" Total number of cells accepted: " + status.numAcceptedCells)
      if(status.cellsRejected.size() != 0){
        println(" Total number of cells rejected: " + status.numRejectedCells)
        println(" First 100 rejected cells: " + status.cellsRejected)
      }
      gridx.close()
    }
    else{
      println "No data available."
    }
  }
}
println "Finished"
return
[/membership]
That’s A Wrap
This is a great example of how we can inject new and creative ways to solve problems with speed in processing, speed in developing, and introducing no additional maintenance. Look for more of these real world wins in the future.


Leave a Reply
Want to join the discussion?Feel free to contribute!