Adventures in Groovy – Part 48: KScope18 Presentations

With Kscope19 quickly approaching, I wanted to remind you of the presentations from KScope18.  It was a great week and I hope to build on what was discussed next year.  I hope you find these valuable.

Presentations

KScope 18, Last Minute Souvenirs (Deep Dive into the ePBCS Groovy GridBuilder)

KScope18 Why Groovy is Game Changing

KScope 18 Top Down and BottomS Up Planning at Breakthru Beverage Group


Adventures in Groovy – Part 14: Returning Errors (Form Cells)

Introduction

To expand on Part 13 of this series, which covers stopping a form from saving when there are validation errors, is identifying the errors by cell and communicating with the user the problems at a cell level.  This does NOT stop at the first error and throw an exception.  This will iterate through all the errors and explain each one at a cell level for the user to correct.  The following example will use similar code and concepts, but will apply validations to each cell by changing the color and setting a tool-tip with the explanation of what the validation error is.

Before we continue, the methods to do this do not make use of the MessageBundle.  I think this is a miss because one bundle can be reused for similar validation, and the current methods assume a single language.  There is a way to use it indirectly.  There is a bug that is causing issues with the method, so we will assume basic functionality and come back to the use of a MessageBundle when the bug is fixed

Throw an Exception (Interrupt Form Save)

The basic inclusion of cell validation is very simple.  As the code iterates and validates the cells, the following will change the background color, add a tool-tip, and invalidate the form and stop it from saving any data to Planning.

def BackErrColor = 16755370 //Red
it.addValidationError(BackErrColor, "error message here",false)

The color can be different for different errors and it completely customizable.  The error message can be anything necessary.

Consolidated Example

The form associated to this rule has the ability to adjust a number by either increasing or decreasing the units by month.

To illustrate this, here is an example of looping through cells and validating two things.

  1. Units can’t ever be adjusted to a negative amount – they can be decreased, but never to a negative value.
  2. Any change to units must be offset to have a full year impact of zero.
def BackErrColor = 16755370 //Red

def CaseTotal = it.crossDimCell('Jan').data + it.crossDimCell('Feb').data + it.crossDimCell('Mar').data + it.crossDimCell('Apr').data + it.crossDimCell('May').data + it.crossDimCell('Jun').data + it.crossDimCell('Jul').data + it.crossDimCell('Aug').data + it.crossDimCell('Sep').data + it.crossDimCell('Oct').data + it.crossDimCell('Nov').data + it.crossDimCell('Dec').data 
operation.grid.dataCellIterator('Working_Inp','Jan','Feb','Mar','Apr','May','Jun','Jul','Aug','Sep','Oct','Nov','Dec').each {
 if(it.data + it.crossDimCell('OEP_Working').data < 0.0)
   {
   def change = it.data + it.crossDimCell('OEP_Working').data
   it.addValidationError(BackErrColor, "Your adjustment forces the new cases to be a negative volume. Increase your adjustment by $change", false)
   }
 else
  {
  if(CaseTotal != 0.0 && it.data != 0.0)
     it.addValidationError(BackErrColor, "Adjustments must not have a full year impact. Currently, the data would change by $CaseTotal.", false)
  }
 }

Enhancement Request

One thing you might notice is the lack of inclusion of the messageBundle object.  I have requested an enhancement, as it only makes sense that it be used here, and they have added it to the enhancement list.  So, look for this be added in the future.  It can be identified internally by the following.

Enh 27656951 – EPBCS – GROOVY FUNCTION ERRORING

I don’t know why, but Oracle has no way of getting the message based on the local from the messageBundle.  Many of the methods, like getMessage, are not made available to us as developers, that would likely circumvent this issue.

Summary

As with the other validation methods, this introduces a huge benefit in both usability and budget accuracy.  Any time data validation can be performed proactively, everybody wins.  There is less of a burden on administrators and users get instant feedback they can easily and quickly fix.


PBCS Data Map / Smart Push Has Data volume Limits

Introduction

When moving data in PBCS with Data Maps or Smart Pushes, they have limits on how much data can be moved.  The amount of data can be seen in the logs, and look something like this.

Failure

Exporting data…
Exported data file(s) size is: 207.1 MB.
Push Data failed. Error: Exported data size of data map that is being executed from groovy is more than permissible amount: 100 MB.

Success

Exported data file(s) size is: 464.7 MB.
EXPORT elapsed time: 39584
IMPORTING – AppName: AreakFin
TRANSFORM elapsed time: 63634
IMPORTING elapsed time: 21166
TOTAL elapsed time: 124553

Prior to the Feb, 2018 release, the following did not always hold true.  If you are/were seeing inconsistencies, see Bug Report: Push Data failed.  It also includes information about how the data cap works, as it is different between Data Maps and Smart Pushes, which is worth reading.

Data Movement Limits Identified

I got the following information from Oracle, and it is useful if you are using the data movement functionality.  When these are developed, it is a good idea to evaluate the size and plan for growth.  If the production data movements are nearing the thresholds, it is recommended to be proactive and try to reduce the POV that is used to move the data.  If it can’t be reduced, one option is to split it into multiple pushes which can be done with Smart Pushes on the Data Form save, or with Groovy.  Groovy also allows you to further condense the POV by dynamically changing the POV based on the cells edited, which is the most productive and efficient way to handle these.

So, here is what was documented.  The data limits imposed on the movement methods are below.

  • There is not a cap when running a Data Map
  • When executing the following, there is a cap of 100MB
    • Smart Push on a Data Form
    • Smart Push via a Groovy Calculation
    • Data Map via a Groovy Calculation

Summary

If you are not seeing this, I would recommend opening a ticket with Oracle to resolve.  I will be writing a post explaining how to execute and override POVs in Smart Pushes and Data Maps with a Groovy Calculation in the near future, so look for an article in my Adventures in Groovy series.


Adventures in Groovy – Part 6: Converting a POV into a Fix

Introduction

One of the fundamental features of a Groovy calculation is the ability to dynamically grab aspects of a grid, and getting the POV is something that is required to dynamically generate an Essbase calculation.  There are times when the entire POV is required, times when only members from specific dimensions are needed, and situations where only the rows and columns of the edited cells are used to construct effective fix statements.  All 3 of these situations will be discussed.

Use Case (Pulling POV Members)

Many times, the Fix statement of a calculation being built includes all members in a data grid POV.

Code

List<String> povMemberNames = operation.grid.pov*.essbaseMbrName 
String calcScript = """   
Fix("${povMemberNames.join('", "')}")
 [Calculation]
EndFix;"""
Breaking It Down

The operation.grid.pov provides access to all the dimensions in the POV.  From that, dimension names, member names, and other properties that are useful, can be accessed.  When followed by a *, it returns all the dimensions in the POV to a list.  Using the essbaseMbrName instructs the function to return every member in the POV.  The povMemberNames variable stores a list  of all those values.

When building the calcScript variable, ${povMemberNames.join(‘”, “‘)} will return the list, delineated with “,”.  This would return something like membername1″,”membername2″,”membername3.  This obviously is missing surrounding quotes, which is why it is embedded inside the quotes.

Use Case (Pulling Selective Dimension Members From The POV)

Pulling one, or all of the dimension values in a POV, in individual variables for later use, provides the ultimate flexibility.  The following pulls all the members and stores them in a unique variable.  Then, any dimension in the POV can be accessed.  An easy way to accomplish this is to use the find method of a List object to filter the elements.

Code

List<String> povmbrs = operation.grid.pov
String curYear = povmbrs.find {it.dimName =='Years'}.essbaseMbrName
String curCompany = povmbrs.find {it.dimName =='Company'}.essbaseMbrName
Fix((${fixValues(curYear, curCompany))
 [Calculation]
EndFix;"""
Breaking It Down

The first line stores the entire POV collection.  That variable can be accessed and used like any Groovy collection.  By using the find method, items in the collection can be filtered.  povmbrs.find {it.dimName ==’Years’} will return the Years dimension object and one of the properties of that object is the essbaseMbrName.  Using it will return an Essbase friendly member name.

The “fixValues” method converts strings to “Fix friendly” strings that can be used in an Essbase calc script.  Any of the following objects can be inserted into this method.

  • AttributeDimension
  • AttributeMember
  • Dimension
  • Member
  • PeriodDimension
  • RtpValue
  • YearDimension

The result is the dimension member name inside a fix statement.

Rows/Columns

Some of the real efficiencies with Groovy stem from the fact that the edited cells can now be determined and a Fix statement can dynamically be generated to isolate longer running calculation on only the rows and columns that have changed.  In the following example, there are two methods to get the members.

Code

Set<String> periods = []  
Set<String> products = [] 
operation.grid.dataCellIterator({DataCell cell -> cell.edited}, MemberNameType.ESSBASE_NAME).each { DataCell cell ->         
  periods << cell.periodName       
  products << cell.getMemberName("Product")     
  } 

String calcScript = """   
Fix("${periods.join('", "')}", "${products.join('", "')}")
 [Calculation]
EndFix;"""
Breaking It Down

If you are unclear about how to iterate through a grid, read Adventures in Groovy Part 3: Acting On Edited Cells.  Inside the dataCellIterator, the example assigns two list objects with the respective members.  Since this only touches the cells that have been edited, only the periods and products that have been updated will be stored in the respective variables.

You may be wondering if this is truly the most isolated combination of data.  Theoretically, the same product may not have the same edited months.  You could further condense changes in the Fix statement by looping through the rows and creating a fix for every row.  In this example, Period is dense, so doing this would not change the number of blocks.  Depending on the application, taking this extra step might prove more efficient.  Rather than complicate this further, we are assuming this isn’t required.

Every required dimension (Account, Entity, Period, Scenario, Version, and Year) has its own method. cell.periodName returns the Period member of the cell.  All the dimensions have the same naming convention.

For custom dimensions, getMemberName can be used with the required dimension passed as a parameter.  If you want consistency, this method can also retrieve the 6 required dimensions.  cell.getmemberName(“DimensionName“), where DimensionName is an actual dimension, returns the respective member in that dimension.

Just like the previous example, add the variable to the Fix statement with a join and it returns the delimited list of members that have been edited.

  • “${periods.join(‘”, “‘)}” returns the list of Periods that have edited cells, and
  • “${products.join(‘”, “‘)}” returns the rows (or products) that have been edited.

Wrapping Up

One last step that can be added, and should be, is the check to see if any cells have been modified by evaluating the size of one of the lists that is created during the grid iteration.  After the iteration is completed, the following can be added to accomplish this.  If there are no cells edited, the calculation is stopped at the return line and nothing is sent back to Planning/Essbase to execute.

if(products.size() == 0) {
    println("No edited cells found!")
    return
}

Joining the examples above, the fix would look like this.

String calcScript = """  
 Fix("${povMemberNames.join('", "')}", "${periods.join('", "')}", "${products.join('", "')}", ${fixValues(curYear, curCompany))
   [Calculation]
EndFix;"""
return calcScript

Conclusion

If you implement this, you will likely see huge performance improvements.  In the client production applications, I have implemented this in, I see at least a 95% improvement in performance.  This same logic can be used for Data Maps and data movements from ASO to BSO (which we will cover later)


Using A Smart List To Dynamically Select Members In A List

With more and more time dependent related data, grabbing the month from a Smart List is becoming more common.  Associating that with a value in the application is required for a number of calculations, including things like

  • An employee’s start or termination date
  • The month an employee’s merit takes affect
  • The month a product becomes inactive
  • When an asset is put into use
  • When a customer is new or leaves
  • When a contract starts

There are several ways to solve this, but the following is very simple and effective.  If you are unaware of the @MEMBERAT function, take a look at this.  It can be used for many other uses, but the following is an example of how to get the value in a period from the month selected in a Smart List.

@MEMBERAT returns the specific member in a list based on an index identified.  This function requires 2 parameters.  The first is list of members.  The second is the index in that list in question.

If we have a Smart List that includes 12 Members, January through December, with a value of 1 through 12 respectively, it can be used in this function to grab the value in the corresponding selected month.

Assume we have a member called Merit Month, which is connected to the Smart List previously explained.  When the user selects the month, the value is stored in that member in Essbase.  When selecting March, a 3 is stored.  Using the @MEMBERAT function, we can dynamically reference the period member.

Crazy Joe Davola has the following properties.

The following calculation would apply the merit increase to the months equal to the Merit Month, and all months after that.

IF( @ISMBR( @MEMBERAT("Jan":"Dec", "Merit Month"->"BegBalance"):"Dec" )
  “Effective Salary” = “Salary”->”BegBalance” * (1 + “Merit Increase”->”BegBalance”) / 12;
ELSE
  “Effective Salary” = “Salary”->”BegBalance” / 12;
ENDIF

The result would be an increase in monthly salary for all months from March through December.

Summary

This can be used for all types of applications.  The same logic could be used for a Smart List with years, or really any application that correspond a list (Smart List) and a list of members in a hierarchy.


Map Smart List to Dimension

As you all notice PBCS does not yet offer the possibility to create attribute dimensions. One of the solutions to get around this is to choose to map a smart list to a dimension in the map reporting module. Follow the steps below to configure your mapping.

Let’s assume that you already have 2 plan types, one BSO and one ASO. In the example below, my plan type names are Finance for the BSO and rFinance for the ASO. In the project where I implemented this solution, I only needed 2 different attributes (Department and Service type) and I didn’t need any customized dimensions.

  • First you need to create the ASO dimensions representing the desired attributes. In my example I have two different attributes: Department and Service Type. On each of these dimensions create the members representing the value of your attribute. Please note that the members’ name must match the value of the smart list consequently, they need to follow the naming convention of the smart list (no spaces or special characters). You will also notice that for each of the dimensions I have created a default member (No_***), I will explain why I did this a bit later on in the post.
  • On the second step we will create the smart list. To do that click on Administration -> Manage -> Smart lists. Then create the new smart lists by clicking on add.

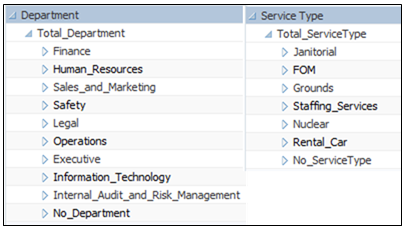
    For now just create the smart lists, we will add value in other steps.
  • Now, we will create the BSO members linked to the smart list. Go to your BSO outline and on the account dimension create 4 members’ names, Department Property, Department Property Input, Service Type Property and Service Type Property Input. Link these members to the correct smart list.
  • Once this step in finished go to refresh the app by clicking on Administration -> Application -> Refresh Database.
  • Now that all members and smart lists are created, let’s create the map reporting application. To do that click on Administration -> Map Reporting Application then click on add.

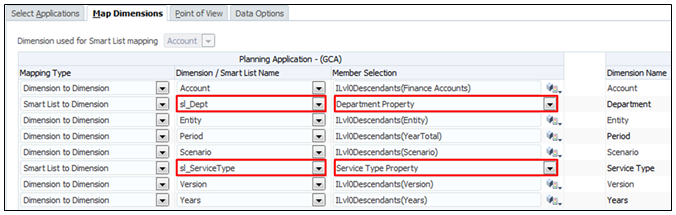
    On the first tab choose your source (Finance) and reporting (rFinance) application, and don’t forget to add a name to the map reporting.
    On the second tab for the department and service type row choose the Smart List to Dimension mapping type, and then choose the appropriate smart list. On the member section choose Department Property and Service Type Property members and click on save.
    Now you should see on the screen the application mapping that you have just created. Select it and refresh it by clicking on refresh
  • Now we will go back to the smart lists that we created in the second step. Since we have linked these smart lists to a dimension, we can now update them automatically. This can help you save a lot of time if you have smart lists with 50 members or more.
    To do this, go on the smart list screen (see step 2). Once you are there, select the smart list and click on synchronize.

    Once this is done, the message below should appear.
  • In order to make the smart list to dimension work, we need to assign an attribute value to every intersection for which we have data. For easy maintenance and to avoid business rules that are running for too long, we will do this by attaching a formula to a member (Department Property and Service Type Property). Go to your outline and edit these members by making them dynamic and by adding the formula that you see in the screen shot below (this formula might need to be updated depending on the name and number of dimensions that you have in your application). You will see in the formula that I’m defaulting the value of the attribute to No_Department, this is because you can’t leave any intersection #missing it will lead the map reporting to an error.
  • The final step is to create the form where the user can set up the attribute of their choice for every entity.
    Go to the form panel to create your form, in the POV section put the member that you put in the above formula. In the row put the level 0 entity and in the column put the member Department Property Input and Service Type Property Input.
    You can now push your data using the previous map reporting application.
Pro: This solution is very easy to maintain for the admin, and if needed you can also let a user play with the attributes.
Con: If you have too many attributes, this can make the size of the application get too big and consequently slower.


FDMEE: Loading Data to Different Plan Types

I’m currently working with a Planning application that has 2 data types with different dimensionality. This proved to cause some issues when I would try to import data via FDMEE. I would receive a validation error during the import phase for dimension UD4 (Customer dimension) which was valid for Plan Type 2 but not for Plan Type 1

For this specific case, I was trying to load data for Plan Type 1, which has a different set of dimensions from Plan Type 2. The customer & product dimensions are not valid for Plan Type 1. Note the settings from the dimension library for both dimensions.

Customer:

Product:

From the setup tab in FDMEE, click Target Application. We need to remove Customer & Product from the “Data Table Column Name” column:

Remove the values for Product & Customer and click save:

Then click refresh metadata:

After refreshing the metadata, go back to the Data Load Workbench and import the data file. The import & validate steps should complete successfully now:


test


Re: testing new connection


go