Choosing a Reporting Mechanism in Planning

Reports out of Hyperion Planning are typically identified in 2 categories.

  • Standard “canned” reports – These reports are used generically in a global aspect to report data in common formats and standardized views. These are often generated in volume and printed for presentations and executive review.
  • Ad hoc reports – These reports are more flexible, often adjusted to explain current variances and market conditions. These reports are most likely generated by analysts and managers producing unique views to explain variances that exist at a point in time.  The need to alter, change, and customize these reports are essential to identify and explaining current business conditions.

Reporting from Hyperion Planning can be completed in 3 (debatably 4) ways.  Deciding which reports are developed, or produced, and in which delivery method, is critical to making the most of the reporting capabilities and development time available.

The recommended approach for reports that are distributed globally, need to have a consistent look and feel, and use standard hierarchies and financial definitions, is to build them in Hyperion Financial Reporting. This will enable users to execute the exact same report, with their specific point of view, and distribute it to anybody in the company.  It can also be mass distributed by email to thousands of users for their specific business ownership when data is finalized.  Reports can be grouped into books so users can easily run a set of reports for their line of business quickly and easily. Development of reports in HFR take a little longer are can be more time consuming to change, so selecting reports in this delivery method should be evaluated and considered carefully.

Reports that consistently change, are not required to be mass produced, or don’t require a defined format, are more commonly produced in SmartView/Excel.  This delivery method provides the ultimate flexibility in creativity and customization.  These reports can be rapidly produced and development and is cost effective.  These reports, although extremely flexible, require complete ownership on data validation by the users, as they don’t change automatically to the changes in the hierarchies of the application.  Developing reports in SmartView/Excel is extremely beneficial when the report changes rapidly and it supports the ability to quickly identify business variances and explain those variances to management.

The following matrix will help you identify the best reporting method for your environment.


Adventures in Groovy – Part 2: Data Validation

Introduction

We all know the Data Form validation rules are serviceable, but they are not robust.  When Smart View advanced and forms were opened in Excel, the validation logic developers had in JavaScript became useless.  Since then, we have really missed the ability to communicate with the user interactively with visual cues and validation rules that halted the saving of data.  Well, Groovy calculations to the rescue!

I will preface with the fact that I am encountering some odd behavior, so I am going to break this up into multiple articles.  It appears that Oracle is validating Groovy enhancements in Data Forms on the web, and not necessarily testing the full functionality in Smart View.  Currently, I have this working in a browser perfectly, but 3 of the 8 columns are failing in Smart View.  I am hoping to get closure to a ticket on this in the near future.  When I get a resolution, I will amend this article with some clarity on either what I am doing wrong, or when it will be resolved.

High Level requirement

At a high level, the planners want to see any seeded value that was changed with a different background color to single out the lines that have been edited.

The Details

We have a form that provides the users the ability to override seeded data.  In this example, a planner can change the Average Price/Case, Net Sales, and/or GP Level 2 at any level of the hierarchy and gets allocated down to level 0 on a % to Total.  This form has the accounts in question for 3 sources.  The override columns are a separate version that is set to top down so security doesn’t prevent them from entering at a non-level 0 member.  This is only used to enter the 3 values, is used to calculate the Input source, and is cleared.

The Initialized source is seeded from prior year growth.  This, in essence, is the basline seeded amount.  At initialization, the Input source is a duplicate of Initialized source.


The Initialized source is also on the form.  When overrides are entered, it is applied to the input source.  At this point in the process, the Input is different from the Initialized source, as shown by the orange color in the previous image.

Why Not Validation Rules?

First, there is limited functionality in the Data Form validation rules.  In this case, the functionality is there, but has an issue with the precision of the data.  Even though Input equals Initialized (or appears to),  validation fails and shows a different background color.  I have seen this before with decimals with large precision.

How Groovy Solves This

Groovy calculations have the ability to traverse through the cells of a Data Form.  The 8 cells that can be impacted by the 3 overrides can be checked against their counterpart in subsequent columns (comparing the same account in the Input source to the Initialized source).  This is for another discussion, but Groovy can actually create temp grids and pull data directly from Essbase that doesn’t exist in the grid, too.

To simplify this, the following only loops through the first column – Avg Price / Case.  This can be replicated easily for all subsequent columns by changing the account in question.

This example uses several Groovy methods/functions.  First, the data grid is stored in a variable, as it will be referenced throughout.  Next, we are using the dataCellIterator, which is the same in the previous post on Groovy.  If you didn’t read that, or don’t understand the iterator, check that out.

At this point, the calculation is requesting to loop through all the cells with Avg Price/Case AND Input in the POV.  Inside the loop, lDestMembers is set to a list equal to all the members in the POV for the relative cell.  memberNames returns every member in the POV in a Groovy list.

The next step is getting the value for the corresponding cell in the Initialized source.  getCellWithMembers accomplishes this with the appropriate parameters passed.  This function accepts member names, so all the members in the Input cell’s POV are used, excluding the source dimension.  This is changed to Initialize.

Lastly, the comparison is made between the two cells.  If they are not identical, setBgColor is executed on the Input source cell to identify it as something that has changed due to an override.

The Calculation

// Initialize a grid
DataGrid curDataGrid = operation.grid
// Set the color to be used if the values are not identical
def iColor = 16746496
// Loop through the cells in column that has
//  Average Price/Case and Input in the POV
operation.grid.dataCellIterator('Avg_Price/Case','Input').each
  {
    // Get the POV for the cell
    def lDestMembers = it.memberNames
    // get the value in the Initialized source that is equivalent to
    // the cell in the Input Source.  The POV form the Input source
    // is used with the exception of the source is changed to Initialize
    def dValue = operation.grid.getCellWithMembers(lDestMembers[0].toString(),
    lDestMembers[1].toString(),lDestMembers[2].toString(),
    lDestMembers.toString(),lDestMembers[4].toString(),
    lDestMembers[5].toString(),"Initialize",lDestMembers[7].toString(),
    lDestMembers[8].toString(),lDestMembers[9].toString(),
    lDestMembers[10].toString()).data
    // if the value is different between the Input and Initialized source,
    // change the background color
    if(it.data != dValue)
    {
      it.setBgColor(iColor)
    }
  }

Data Form Changes

This new Groovy Business Rule should be added to the form and executed on load and save.  This will ensure that the accounts that have been changed are identified both before, and after, the user makes any changes.  One more note that might save you hours of frustration – make sure this rule runs last when other rules are also executed!

Conclusion

This opens up a lot of options that far surpass the default form validations.  Other options are available.

  • Tool-tips can also be assigned to a cell instructing the user how to resolve a validation error, if one exists.
  • The form save can be interrupted, stopping the user from saving data on a form (or even saving only parts of the form) when validation errors exist.
  • Data can be altered to force validation prior to saving.
  • Detailed messages can be displayed with instructions and other communication to the user.
  • Have specific calculations executed based on the data entered.

This is not an exhaustive list.  We, as developers and architects, literally can do anything we want and have complete control over what happens and what doesn’t happen.  This is exciting because we have nearly complete control over what happens on save.  If you have other ideas, or questions, please share them with comments.


Managing Smart View Shared Connections

If you use Smart View, you are familiar with the Smart View Shared Connection URL, which is unique to the environment that Smart View connects.  That property is saved in a file on your computer and has the default URL, as well as all the saves URLs in the drop-down list.

There are times users want this drop down cleaned up.  If the URL changes due to environment changes, or they enter the wrong URL and it is saved, the need to clean up what is in this setting can reduce confusion and user frustration.  Often, IT departments want to deploy these settings and need to understand how to make every user’s Smart View configuration the same.  Understanding where these settings are stored and how the file that stores them is configured will assistance with either of these requests.

The user’s computer will hold, or require a file if a new deployment of settings is the path IT takes, in the following folder.

<drive>:\Users\<username>\AppData\Roaming\Oracle\SmartView

The drive is almost always C, and the username is unique to every organization in the naming convention used.  If the user already has setup Smart View, a file named properties.xml exists.  This file can be edited in any text editor.  If you are familiar with XML files, you will see a typical XML structure.

The entire file is enclosed in a cfg tag, so it is opened with <cfg> and closed with </cfg>.  The current provider URL is within a provider tag.  All saves provider URLs are inside a previousURLList tag and separated by a pipe (|) delimiter.  So, the file is laid out like this.

<?xml version=”1.0″?>
<cfg>
<provider></provider>
<previousURLList>provider 1|provider 2|provider 3|…</previousURLList>
</cfg>

As a consultant, I have many providers saved, so the configuration.xml file on my system looks like a little busy.  The file will likely be smashed together and not easily readable.  Opened in a text editor:

<?xml version=”1.0″?><cfg><provider><overrideWorkspaceUrl>https://planning-test-a499161.pbcs.us6.oraclecloud.com/workspace/SmartViewProviders</overrideWorkspaceUrl><previousURLList>http://mp1epm01:19000/SmartViewProviders|http://mp1epm01:19000/workspace/|https://planning-a499161.pbcs.us6.oraclecloud.com/workspace/SmartViewProviders|https://planning-test-a499161.pbcs.us6.oraclecloud.com/workspace/SmartViewProviders|https://planning-test-a499161.pbcs.us2.oraclecloud.com/workspace/SmartViewProviders|https://planning-test-shiloh.pbcs.us2.oraclecloud.com/workspace/SmartViewProvidersx|http://mp1epm01.huronconsultinggroup.com:19000/workspace/SmartViewProviders|https://mp1epm01:19000/SmartViewProviders|https://mp1epm01.huronconsultinggroup.com:19000/aps/SmartView|https://mp1epm01.huronconsultinggroup.com:13080/SmartViewProviders</previousURLList><overrideUrl/></provider></cfg>

If this file is opened in an XML editor, or viewed in Internet Explorer, it will be more readable.

If old providers need to be removed, they can be deleted from this file and the user will see the change the next time Excel is started. If there is a need to distribute a pre-configured setup, build this file manually, or use an existing user’s file, and deploy it to all new users.


My Adventures in Groovy Calculations – Part 1

What Is Groovy

Recently, Groovy scripting was added to ePBCS business rules as an option instead of the GUI, or the go-to scripting for you old-timers who still refuse to change.  These are defined in the Business Rule editor as Groovy calculations.  So, what is Groovy?

“Apache Groovy is an object-oriented programming language for the Java platform. It is a dynamic language with features similar to those of Python, Ruby, Perl, and Smalltalk. It can be used as a scripting language for the Java Platform, is dynamically compiled to Java virtual machine (JVM) bytecode, and interoperates with other Java code and libraries. Groovy uses a Java-like curly-bracket syntax. Most Java code is also syntactically valid Groovy, although semantics may be different.”

If you haven’t heard of Groovy, you may want to do some research.  Oracle is using more and more Groovy in applications as administrative options and a communication method between applications.  Groovy is a standard and can be used with millions of applications and websites with the REST API.

What Groovy Script/Calculations Are Not

Groovy calculations are not java-based calculations.  It is not a new calculation language.  It does provide a way to interact with a Data Form in ePBCS and build a calculation script dynamically.  So, Groovy, in the context of Groovy Calculation Scripts, does not connect to Essbase via Groovy Business Rules. It simply builds a string that is sent to Essbase as a calculation.  It does, however, interact with Planning and that is where the power starts.  With the ability to have all the Groovy functionality to manipulate strings and now the ability to interact with the data form, dynamic calculations can be built.  The calculation script sent to Essbase is no different, but the script can now be dynamically generated based on things like, the POV, the text value of a Smart List, whether the values in the grid were updated, whether the data entered meets validation criteria, and other similar things.

If you are experienced with Hyperion Planning, you may have dabbled with JavaScript to do data validation, calculate data prior to the user submitting it, or prevent users from submitting data.  It was a great option to provide feedback to users, but that basically was useless when Smart View allowed users to open Data Forms in Excel. The JavaScript did nothing unless the form was opened in an internet browser.

Getting Started

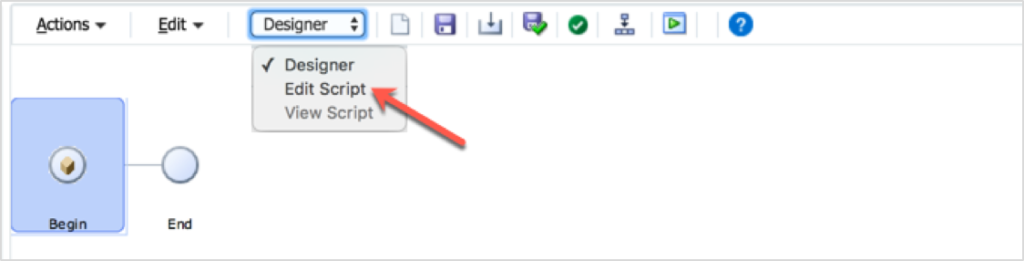
The first step in creating a Groovy Calculation Script is to, well, create one.  To do that, create a new business ruleChange the view from Designer to Edit Script.  If you haven’t noticed this before, it provides a way to toggle the GUI to a script view.

Next, find the drop-down box in the toolbar to the far right named Script Type.  This option will read Calc Script.  Change it to Groovy Script.

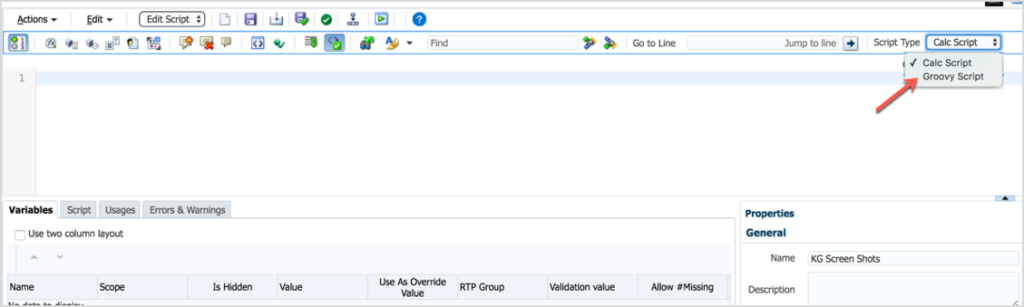
AAt this point, the script window is now set to validate Groovy script, not Essbase syntax. Even though it doesn’t do anything yet, you have just created your first Groovy Business Rule!

Use Cases

There is a lot of potential in this functionality.  To get you thinking, here are some examples:

  1. Execute calculations on large sparse dimensions on ONLY the members that changed on the form.
  2. Access the Smart List text to do validation, use in calculations, and store for later use in Essbase (maybe save a member name in a member that is numeric, like employee ID, Cost Center, or account).
  3. Perform validation before the calculation is built and sent to Essbase. For example, if the sum of a column used to allocate dollars doesn’t sum to 100, send a calculation that ONLY returns a message and doesn’t perform the allocation.
  4. Perform text manipulation previously done in Essbase with functions.  Concatenating member names and truncating member name prefixes and date formats are some of the few I use regularly.  Many of these functions are extremely slow and force the calculation to execute in serial mode, so to be able to do them outside the script is now an option.

Real World Example

The Problem

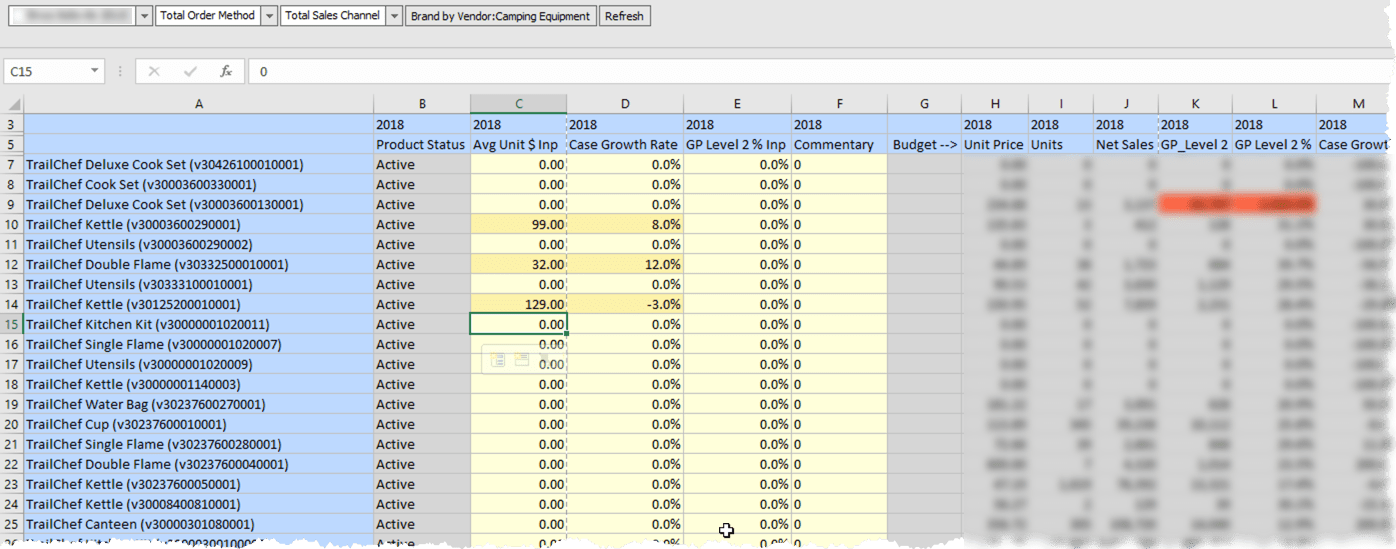
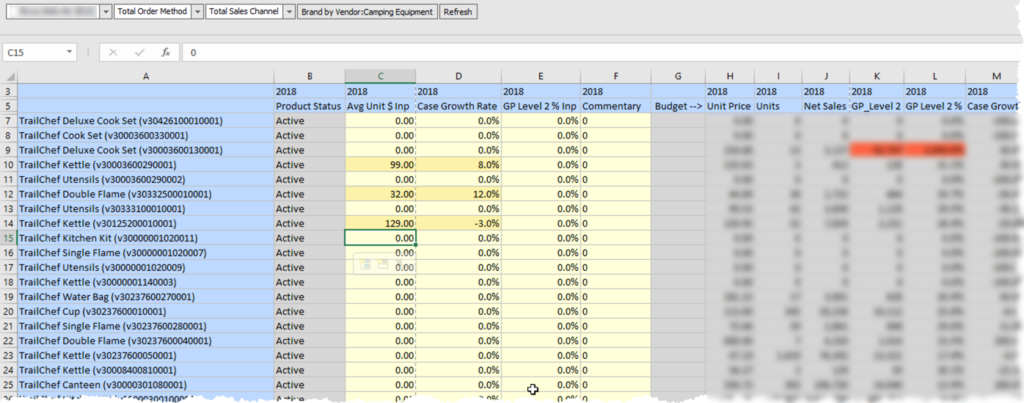
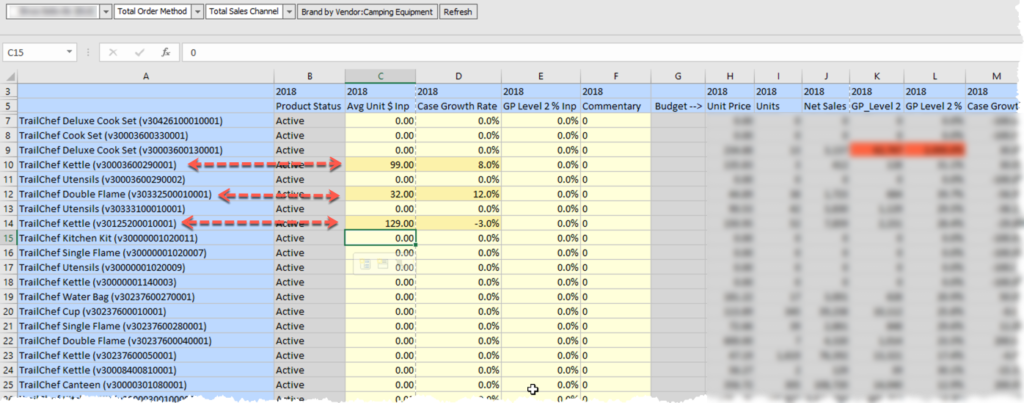
I am working with a client who wants to override the result of driver-based calculations based on historical trends.  In this example, the volume of cases can be changed and the profit rate can be adjusted.  Once the form is saved, the overrides need to be removed.

Here-in lies the challenge.  If the overrides are removed and the calculation runs on all members in the form, the results would revert back to what they were prior to the override because the override values no longer exist in the database or Data Form.  So, rather than perform the calculation on the override, it would use #missing  or zero, and take the results right back to what the drivers dictated.  The most obvious way around this issue is to execute the calculation on ONLY the rows (vendors in this example) that were edited. In other words, dynamically generate the FIX statement on the vendors that were updated.

The Non-Groovy FIX Statement

Without Groovy, the FIX statement would include @RELATIVE(“Vendor”,0) to run the calculation on all venders on the Data Form.  This has 2 issues.  One, it calculates all the vendors and will change the vendors back to the pre-override values.  Two, every time the user saves the form, the fix is traversing through 30,000 possible vendors.  Although most companies have less than 8,000 active vendors, it still poses a performance issue calculating 8,000 blocks when only a few typically change.

The only aspect of the calculation that is going to change in this situation is the FIX statement, so that will be the only piece shown in the comparison between a Groovy script and a non-Groovy script.

FIX(&vScenario,
    &vVersion,
    &vCompany,
    &vYear,
    "Local",
    "Input",
    @RELATIVE(“Vendor”,0),
    "Jan":"Dec",
    "Regular_Cases")

The Groovy FIX Statement

Since Groovy can dynamically create the calculation script, it looks more like the example below. The sPov will be a string variable in Groovy that holds all the members in the data form’s POV.  The sVendors Groovy variable will hold the list of vendors that have been edited.

FIX($sPOV
    $sVendors,
    "Jan":"Dec",
    "Regular_Cases")

@RELATIVE(“Vendor”,0), which would produce a list of every vendor in the hierarchy, is replaced with “V300000300040003”, “V300000300060001”, “V300000300070002”.

The issue of running the calculation on vendors that have not been edited has now been solved.  An added benefit is that the calculation runs on 3 of the 8,000 blocks, so what took 30 seconds now completes in under a second.

Now, The Interesting Part

Let’s dissect the Groovy calculation script piece by piece.

Setting The Stage

For Groovy to perform operations, there are a few housekeeping items that need to be addressed.  First, a few string builders need to be created to store some variables of strings that grow through the process and are concatenated to Essbase calculation before it is submitted for processing.

There are some variables used to interact with the form’s data grid.  For easy reference to the grid through the script, the grid object is stored in a variable (curgrid).  Next, a variable is created to hold the result of the cells that have been edited (itr).    The likelihood that these variables would exist in most of the scripts is high, so it might make sense to get familiar with these objects and their parameters.

//Get current Data Form
DataGrid curgrid = operation.getGrid()

// Construct a string builder
// Holds the calculation script sent to Essbase
StringBuilder scriptBldr = StringBuilder.newInstance()

// Holds the value for the venders that have changed
StringBuilder vendorList = StringBuilder.newInstance()
String sVendors

// Iterater which gives you only the edited cells
GridIterator itr = curgrid.getDataCellIterator(PredicateUtils.invokerPredicate("isEdited"))

// Holds the list of members from the POV – the function returns an array, so this
// parsed the array and places quotes around each member and separates them with a comma
String sPov = '"' + curgrid.getPov().essbaseMbrName.join(',').replaceAll(',','","') + '"'

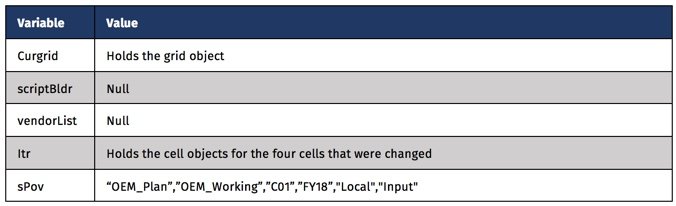
At this point the values of the variables are as follows.

Find the Vendors That Have Changed

We know the users will enter overrides in this Data Form (Case Growth and Average Price).  The following piece of the Groovy script will build a delimited list of those vendors based on the rows that have been edited.  It will include quotes around the member names to account for any member names that are numeric or have special characters and will be separated by a comma.  Groovy provides the ability to append to a string with <<”””, and close it with “””.  The if statement ensures that a vendor will not be appended to the string if multiple columns are changed.

// Loop through each cell that was edited and build the vendor list
// If multiple cells on the same row are edited, only add vendor once
itr.each{ DataCell cell ->
  sVendors = cell.getMemberName("Vendor")
  if(vendorList.indexOf(sVendors) < 0){
    vendorList <<"""
   ,"$sVendors"
   """
  }
}

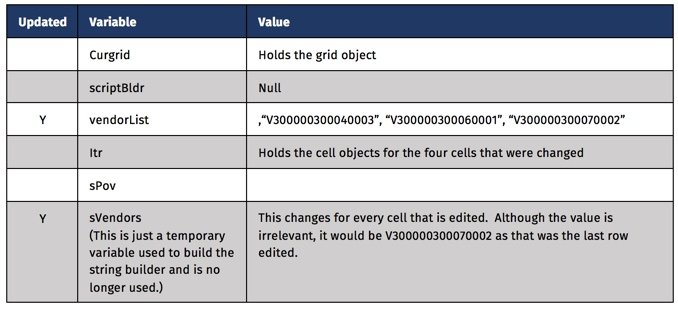
At this point, only a few variables have changed. The bulk of the Groovy functionality is finished.  We now have the POV and the list of vendors that need to be in the FIX statement.

The Essbase Calculation

The next section will append text to the scriptBldr string.  This string will ultimately be sent to Essbase as the calculation to be performed.  Groovy variables are embedded and replaced with the value that they were set to previously.  The two used in this calculation are $vendorList and $sPOV.  Other than those two pieces, everything else is pulled from the original Business Rule and highlighted in red below.

// Add the calculation defined in a business rule to the string variable
// the POV and Vendor List will be used to dynamically set the FIX statement
scriptBldr <<"""
VAR v_Price;

FIX($sPOV
    $vendorList,
    "Jan":"Dec",
    "Regular_Cases")

  /* Calculate Overrides */
  "OEP_Working"(
  v_Price = "Avg_Price/Case"->"YearTotal";

  "Regular_Cases" = (1 + "Case_Growth_Rate"->"BegBalance") * 
                    ("Regular_Cases"->"FY16"->"Final");
  IF("Avg_Price/Case_Inp"->"BegBalance" == #Missing)
    "Net_Sales" = (v_Price) * (1 + "Case_Growth_Rate"->"BegBalance") * 
                  "Regular_Cases"->"FY16"->"Final";
  ELSE
    "Net_Sales" = ("Avg_Price/Case_Inp"->"BegBalance") * 
                  (1 + "Case_Growth_Rate"->"BegBalance") *
                  "Regular_Cases"->"FY16"->"Final" ;
  ENDIF

  IF("GP_2_%_Inp"->"BegBalance" == #Missing)
    "GP_Level_2" = ("GP_Level_2_%"->"YearTotal"->"FY16"->"Final") * "Net_Sales" ;
  ELSE
    "GP_Level_2" = ("GP_2_%_Inp"->"BegBalance") * "Net_Sales" ;
  ENDIF
  )
ENDFIX

FIX($sPOV
    $vendorList)

  CLEARDATA "Avg_Price/Case_Inp"->"BegBalance";
  CLEARDATA "GP_2_%_Inp"->"BegBalance";
  CLEARDATA "Case_Growth_Rate"->"BegBalance";
ENDFIX
"""

At this point, the scriptBldr variable is a complete Essbase calculation that can be validated in any Business Rule.

Finishing UP

The last thing required is to send the calculation text built above to Essbase.

println scriptBldr // Sends the script to the log
return scriptBldr // Sends the script to Essbase

Verifying What Was Sent To Essbase

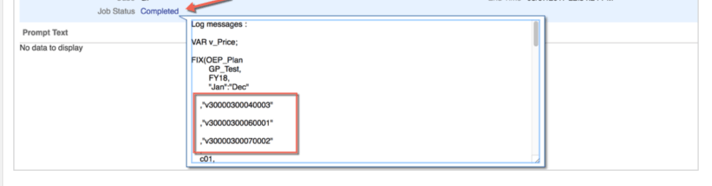
When the Data Form is saved, the results in the form can be validated back to the logic to verify that the calculation worked as expected.  Regardless of whether the calculation executes with or without failing, the value of scriptBldr ( calculation sent to Essbase) is captured in the Job console.

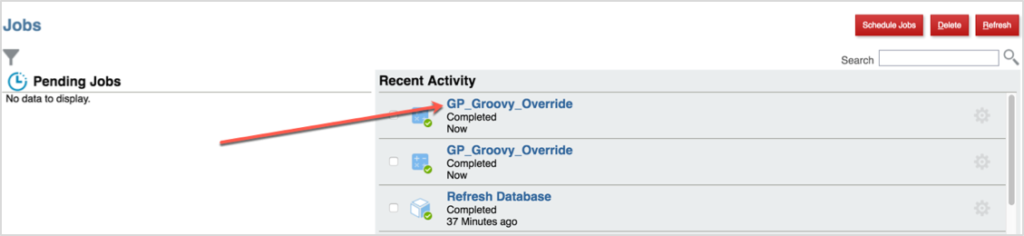
In the Job console, click the Job Status link.  This includes the value of the scriptBldr variable.  The text can be copied from this window, and if it failed to execute, can be copied into a Business Rule and validated there to find the issue.

Wrapping Up

I will admit that I am not a Java programmer, so I am still educating myself on the potential this affords developers.  I am struggling to digest the API documentation and to truly understand the depth of the possibilities. I do know this opens up a whole world we didn’t have with Hyperion Planning. I plan on learning and using Groovy calculations more and more because of the possibilities it provides.  Look for more examples and knowledge sharing as I get my hands around the API and integrate this into more delivery solutions.  To get future publications, sign up to be notified about new posts and articles at www.in2hyperion.com.


Using a Shared Connection with HSGetValue/HSSetValue with Planning or PBCS

If you are a fan of the HSGetValue and HSSetValue, you probably are using a private connection. As you know, anybody that uses the template has to either change the connection string to their own predefined private connection, or set up a private connection with the same name. When dealing with inexperience users, both methods can be problematic.

You may be surprised to know that the Get and Set Value functions can use a shared connection. Rather than using the private connection name, the following can be specified to use a shared connection in place of the private connection name.

Private connection syntax:
HsGetValue(“PrivateConnectionName”,”POV”)
HsSetValue (dollar amount,”PrivateConnectionName”,”POV”)

Shared connection syntax:

HsGetValue(“WSFN|ProviderType|Server|Application|Database”,”POV”)
HsSetValue (dollar amount,”WSFN|ProviderType|Server|Application|Database”,”POV”)

Parameter Summary

  • “WSFN” is a static string and never changes
  • The provider type for planning is “HP” regardless of whether the server is a cloud server or on premise server
  • The server specifies the location of the server housing the application. For PBCS, use the URL provided by Oracle (planning-test-domain.pbcs.us2.oraclecloud.com)
  • The application is the application name
  • The database is the plan type, or database name

Put that all together and the string looks like this.
WSFN|HP|planning-test-A12345.pbcs.us2.oraclecloud.com|Finance|Revenue

Conclusion

Although there are a few drawbacks to using a shared connection (users could use the wrong connection and not get the expected result), my experience has been that the pros (no setup of private connections, can be used in multiple environments without changing anything, etc.) far outweigh the cons.


Remove Dimensions From Planning LCM Extracts

Problem

I am currently working with a client that is updating a planning application and one of the changes is to remove a dimension.  After the new application was setup and the hierarchies were modified to meet the objectives, migrating artifacts was the next step.  As many of you know, if you try to migrate web forms and composite forms, they will error during the migration due to the additional dimension in the LCM file.  It wouldn’t be a huge deal to edit a few XML files, but when there are hundreds of them, it is extremely time consuming (and boring, which is what drove me to create this solution).

Assumptions

To fully understand this article, a basic understanding of XML is recommended.  The example below assumes an LCM extract was run on a Planning application and it will be used to migrate the forms to the same application without a CustomerSegment dimension.  It is also assumed that the LCM extract has been downloaded and decompressed.

Solution

I have been learning and implementing PowerShell scripts for the last 6 months and am overwhelmed by how easy it is to complete complex tasks.  So, PowerShell was my choice to modify these XML files in bulk.

It would be great to write some long article on how smart this solution is and overwhelm you with my whit, but there is not much too it.  A few lines of PowerShell will loop through all the files and remove the XML tags related to a predefined dimension.  So, let’s get to it.

Step 1 – Understand The XML

There are two folders of files we will look to.  Forms are under the plan type and the composite forms are under the global artifacts.  Both of these are located inside the resource folder.  If there are composite forms that hold the dimension in question as a shared dimension, both will need to be impacted.  Scripts will be included to update both of these areas.

Inside each of the web form files will be a tag for each dimension, and it will vary in location based on whether the dimension is in the POV, page, column, or row.  In this particular example, the CustomerSegment dimension is in the POV section.  What we want to accomplish is removing the <dimension/> tag where the name attribute is equal to CustomerSegment.

For the composite forms, the XML tag is slightly different, although the concept is the same.  The tag in composite form XML files is <sharedDimension/> and the attribute is dimension, rather than name.

Step 2 – Breaking Down the PowerShell

The first piece of the script is just setting some environment variables so the script can be changed quickly so that it can be used wherever and whenever it is needed.  The first variable is the path of the Data Forms folder to be executed on.  The second is the dimension to be removed.

# Identify the source of the Data Forms folder and the dimension to be removed
# List all files, recursively, that exist in the path above
$files = Get-ChildItem $lcmSourceDir -Recurse | 
where {$_.Attributes -notmatch 'Directory'} |

The next piece of the script is recursing through the folder and storing the files in an array.  There is a where statement to exclude directories so the code only executes on files.

# List all files, recursively, that exist in the path above
$files = Get-ChildItem $lcmSourceDir -Recurse | 
where {$_.Attributes -notmatch 'Directory'} |
Step 3 – Removing The Unwanted Dimension

The last section of the script does most of the work.  This will loop through each file in the $files array and

  1. Opens the file
  2. Loops through all tags and deletes any <dimension/> tag with a name attribute with a value equal to the $dimName variable
  3. Saves the file
# Loop through the files and find an XML tag equal to the dimension to be removed
Foreach-Object {

$xml = Get-Content $_.FullName
$node = $xml.SelectNodes(“//dimension”) |
Where-Object {$_.name -eq $dimName} | ForEach-Object {
# Remove each node from its parent
[void][/void]$_.ParentNode.RemoveChild($_)
}
$xml.save($_.FullName)
Write-Host “($_.FullName) updated.”
}

Executing The Logic On Composite Forms

The above concepts are exactly the same to apply the same logic on composite forms files in the LCM.  If this is compared to the script applied to the web forms files, there are three differences.

  1. The node, or XML tag, that needs to be removed is called sharedDimension, not dimension. (highlighted in red)
  2. The attribute is not name in this instance, but is called dimension.  (highlighted in red)
  3. We have added a counter to identify whether the file has the dimension to be removed and only saves the file if it was altered.  (highlighted in green)
The Script
$lcmSourceDir = "Z:\Downloads\KG04\HP-SanPlan\resource\Global Artifacts\Composite Forms"
$dimName = "CustomerSegment"
# List all files
$files = Get-ChildItem $lcmSourceDir -Recurse | where {$_.Attributes -notmatch 'Directory'} |
# Remove CustomerSegment
Foreach-Object {
  # Reset a counter to 0 - used later when files is saved
  $fileCount = 0

$xml = Get-Content $_.FullName
$node = $xml.SelectNodes(“//sharedDimension“) | Where-Object {$_.dimension -eq $dimName}  | ForEach-Object {
#Increase the counter for each file that matches the criteria
    $fileCount++
# Remove each node from its parent
[void][/void]$_.ParentNode.RemoveChild($_)
}
# If the dimension was found in the file, save the updated contents.
  if($fileCount -ge 1) {
$xml.save($_.FullName)
Write-Host “$_.FullName updated.”
    }
}

Summary

The first script may need to be run on multiple plan types, but the results is an identical folder structure with altered files that have the identified dimension removed.  This can be zipped and uploaded to Shared Services and used to migrate the forms to the application that has the dimension removed.

The scripts above can be copied and pasted into PowerShell, or the code can be Downloaded.


Use PowerShell to split large files by month/year for data loads into FDMEE on PBCS

If you are using PBCS, you may run into some challenges with large files being passed through FDMEE.  Whether performance is an issue or you just want to parse a file my month/year, this script might save you some time.

The Challenge

I recently had the need to break apart a file.  The source provided one large text file that included 2 years of data that was needed to populate the history of an employee metrics application.  The current process loaded files by month and we wanted to be able to piggy back off the existing scripts to load and process data in FDMEE and the monthly Planning data pushes to the ASO reporting cube.  So, the need break the data file into seperate files by month and year was required.  The file was delimited and formatted like the following.

Entity,Year,Scenario,Period,Account,Date,Employee,Pay Code,JobNumber,Data
BU1005,FY15,Actual,Feb,Pay Amount,02/02/2015,V1398950,P105,,108.10
BU1005,FY15,Actual,Feb,Pay Amount,02/03/2015,V1398950,P105,,108.92

The goal was to have a file for every unique month and year combination that included only the lines of the relevant time periods.  The header of the file also had to exist in each of the smaller files.  Since we were working on a Windows machine, we used PowerShell to script the solution.

Powershell Script Directions

The script is pretty simple to use and understand.  Update the script as follows.

  1. Create a new text file with a ps1 extension and paste the following into that file.
  2. Update the srcFile variable to point to the file to be parsed.
  3. Update the startYear to the first year in the file to be extracted.
  4. Update the currentYear variable to the last year in the file to be extracted.
  5. Update the ProcessName to a meaningful word or phrase that will be used to create the file name.
  6. Save the file and execute it like any other PowerShell script.

This will produce 12 files for each year with the header line and the data related to the month and year that represents the year and month in the file name.

Disclaimer

I welcome feedback on improving performance and will give credit to anybody that can improve on this.  I am NOT an expert in PowerShell and I am sure there are faster ways to accomplish this.  This created 12 files (1 year / 12 months) from a file that includes 7.8 million records and completed in 24 minutes.  So, this is pretty reasonable for one-off requests, but might need attention if it was a repeatable need.

This was developed using PowerShell 5 and some functions do not work in earlier adoptions of the software.

Powershell Script

#######################################################################
# Set the file to parse
# 
# Set the start year and end year
# 
# Change the counter if you want the files produced to start at
# something other than 1
#######################################################################
# Write a status to the screen to monitor progress
write-host "Processing started at $($(Get-Date).ToShortTimeString())"

# Update to point to the source file
$srcFile = "C:\Oracle\GCA\Data\Files\2015 Time Data\Time_DataPayAmount2015.csv" 

# Set to the first year you want to process
$startYear = 2015 
# Set to the last year you want to process
$currentYear = 2016 

# Used in the naming, is the starting number in name and increments by 1
$counter = 1 

# Get the first line (the header line) of the file 
$Header =  Get-Content $srcFile -First 1 

# Set the process name used in the file name 
$ProcessName = "Test Process" 

# Loop through each year in the range 
ForEach ($Years in $startYear..$currentYear )
 {
   # Loop through each month of the year
   ForEach ($months in 1..12 )
   {
     # Get the 3 month abbreviation of the month being processed
     $ShortMonth = (Get-Culture).DateTimeFormat.GetAbbreviatedMonthName($months)

     # Format year to FYxx (This is typically required on a Planning application)
     $FormattedYear = "FY" + 
     $Years.ToString().substring($Years.ToString().length - 2, 2)

     # Set the file name to a number starting with 1, the Month, and the year
     # Example: 01_ProcessName_Jan_2015.txt
     $FileOut = "{0:00}" -f $counter++ + "_" + $ProcessName + "_" + 
     $ShortMonth + "_" + $Years + '.txt'

     # Write out the header to the newly created file file
     $Header | out-file -filepath $FileOut -Encoding utf8  

     # Write out all the lines that match the month and year. The pattern 
     # includes a ".*" which is the equivalent of an AND conjunction, so 
     # the line has to include the processing year AND processing month 
     # for it to be included.
     select-string $srcFile -pattern "${FormattedYear}.*($($ShortMonth))" | 
     foreach {$_.Line} | out-file -filepath $FileOut -Encoding utf8 -Append

     # Write a status to the screen - this is not required but provides a level
     # of the current progress by communicating the Month/Year completed and the
     # time it completed  
     write-host $fileout "Completed at $($(Get-Date).ToShortTimeString())"
   }
 }

Conclusion

Hopefully this will benefit the community.  As I create more scripts like this, I plan to share them.


Free Slide on The Benefits of PBCS

I have been using PBCS for over a year now.  As much as it surprises me, I am a fan.  From my experience, I have seen good performance, above average stability, above average accessibility, and I enjoy the cutting edge functionality that is lacking with on-premise implementations.  I created some info-graphics for presentations and thought I would share with the community.  As always, if you would like to contract me for design work, I am always excited to take on interesting and challenging work.  If you would like to donate, click the link to the right.

#gallery-1 { margin: auto; } #gallery-1 .gallery-item { float: left; margin-top: 10px; text-align: center; width: 50%; } #gallery-1 img { border: 2px solid #cfcfcf; } #gallery-1 .gallery-caption { margin-left: 0; } /* see gallery_shortcode() in wp-includes/media.php */

Please remember that I put a lot of work into these works, so please do not alter or use without consent.


PBCS Pro Tip: Manage Multiple Test Accounts with One Gmail Address

Working with Jake Turrell always benefits me in many ways.  Jake found a fantastic way to minimize the effort it takes to create test accounts for testing and training Planning users.  You no longer have to create new multiple accounts.

“During the testing phase of most Planning implementations, developers need to create test user accounts.  I typically create at least one test user for each security group so I can verify that the correct access has been assigned.  With an on-premises Hyperion Planning implementation, this is easy – simply create user ID’s in the Shared Services native directory.  With PBCS, creating bulk test ID’s can be difficult, as each user ID requires a unique e-mail address.  If you need 50 test users, should you create 50 fake/temporary e-mail accounts?  Luckily the answer is no.”

Check out how here.

About Jake

Jake Turrell is a Hyperion Architect and Oracle Ace Associate with over 20 years of experience implementing Enterprise Performance Management solutions. Jake’s technology career began in the early 90’s as a Financial Systems intern at Dell in Austin, Texas, administering IMRS Micro Control (the DOS-based predecessor to Hyperion Enterprise). After working at Dell, Jake joined Ernst & Young’s Management Consulting practice where he worked with a variety of technologies. He later returned to the Hyperion world and joined a boutique Hyperion consulting firm in Dallas, Texas.
Jake has spent the last 17 years implementing Hyperion Planning and Essbase solutions for a variety of clients across multiple industries. Certified in both Hyperion Planning and Essbase, Jake holds a BBA from the University of Texas at Austin.


PBCS Architecture

For those of you that know me, I have a little graphic designer in me.  I frequently develop things that may be useful to others in the industry and like to share.  Below are 2 images that you may use with the understanding that the logo has to remain and can’t be re-branded.  If you would like to have this customized and your logo added, contact me and we can discuss the options.

PBCS Architecture

I was asked to summarize the PBCS Architecture.  Since this isn’t proprietary, here you go.

PBCS Architecture


Pizza As A Service

I won’t take credit for this concept.  You can find this all over the internet.  I was a little bored and wanted to present the concept to a client so I decided to recreate it a little more professionally.  This compares software as a service (SASS) to pizza.  Hope you can benefit from it and maybe get a few laughs.

Pizza As A Service