My Grid Rows Aren’t Aligned To My Data Rows

No, your eyes aren’t playing tricks on you. The grid lines don’t align with the row headers. It is very slight on smaller forms, but forms with hundreds of rows compounds the issue. The further down the grid, the more of an issue the offset is.

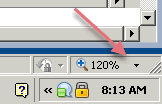
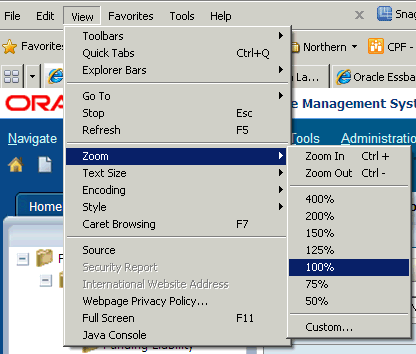
If you have ever seen this issue and pulled your hair out trying to figure out why it happens with some users and not others, fixing it is embarrassingly (now that I know) easy. Change the zoom in IE back to 100%!

Take a look at the bottom right area of IE.  If you see that the zoom is NOT 100%, select the View / Zoom / 100% menu.

Hopefully this will save you some time if you ever run accross this issue.


Change Application Maintenance Mode via Command Line

Patch Set Update: 11.1.2.1.600 offers a welcome utility

If you have ever tried to automate the state of a Hyperion Planning applications’ Application Maintenance Mode, you found it difficult. The only way to accomplish this was to run a SQL Update on the repository table, and for this to take effect, the Planning service had to be restarted.

If you are unfamiliar with the Application Maintenance Mode setting, it is found in Administration/Application/Settings menu. Changing this setting from All Users to Administrators, locks out planners from using the application. It is typically used when changes are made to hierarchies, web forms, system settings, security, and during deploys, to keep users out while changes are being introduced.

Patch Set 11.1.2.1.600, and the corresponding patch release for 11.1.2.2, introduces a new utility that allows administrators to change this setting from a command line. YEAH, it can now be automated without restarting Planning!

Without Further Adieu

MaintenanceMode.cmd (or MaintenanceMode.sh in UNIX) is found in the <EPM_PLANNING_INSTANCE> directory. The following parameters can be passed, separated by commas.

  • /A=app – Application name (required)
  • /U=user – Name of the administrator executing the utility (required)
  • /P=password – The administrator’s password (required)
  • /LL=loginLevel – [ALL_USERS|ADMINISTRATORS|OWNER]

ALL_USERS – All users can log on or continue working with the application.

ADMINISTRATORS – Only other administrators can log on. Other users are forced off and prevented from logging on until the parameter is reset to ALL_USERS.

OWNER – Only the application owner can log on. All other users are prevented from logging on. If they are currently logged on, they are forced off the system until the option is reset to All_USERS or ADMINISTRATORS. Only the application owner can restrict other administrators from using the application.

  • /DEBUG=[true|false] – Specify whether to run the utility in debug mode. The default is false. (optional)
  • /HELP=Y – View the utility syntax online (optional)

Example

MaintenanceMode.cmd /A=app1,/U=admin,/P=password,/LL=ADMINISTRATORS

MaintenanceMode.cmd /A=app1,/U=admin,/P=password,/LL=ALL_USERS


Article Now Available in InVision

Josh Forrest and I presented at last year’s Collaborate conference.  Along with that presentation, we wrote a white paper on the implementation of Hyperion Planning.  This paper included process of selecting a vendor, the project goals, requirements gathering, project methodology, and even the lessons learned once the implementation was completed.

The editors of OAUG asked us if they could publish the article in the summer edition, which was released this week.  The article was written closely with Abercrombie & Fitch and represents the process from the business, not from the consulting services, point of view.

The article can be downloaded here at www.oaug.org.  Access to the article requires free registration.


BUG REPORT – Shared Members Security in EPMA

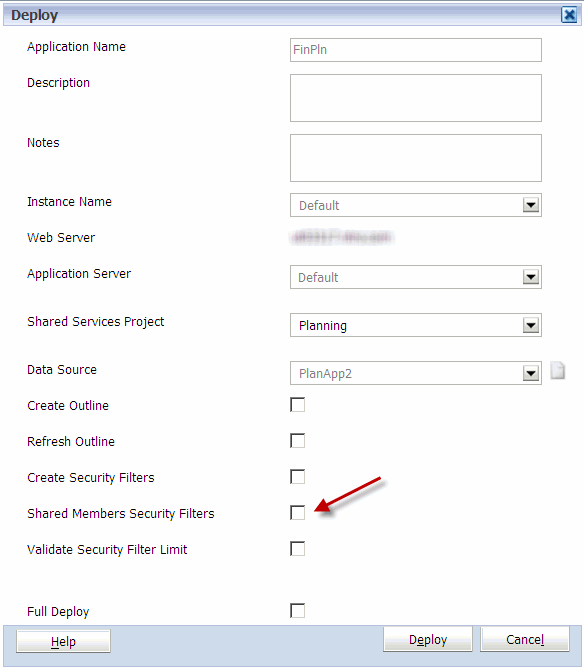
Oracle has confirmed a bug related to the deployment of security with a planning application maintained in EPMA in version 11.1.2.x.  When the Shared Members checkbox is selected in an EPMA deployment of a Planning application, it ignores this option.  Even if the Shared Members box is checked, the user still only gets access to Ohio Region, and not the children, in the example below.   Oracle is currently working on a patch.

What Does Checking Shared Members Do?

By default, any member that is a shared member under a parent with security, it gets excluded.  For example, if the security for Ohio Region is set to @IDESCENDANTS with READ access, the three members below Ohio Region would have no access.
– Ohio Region
– Columbus (Shared)
– Cincinnati (Shared)
– Cleveland (Shared)

The filter that gets pushed to Essbase would look something like this.

@REMOVE(@IDESCENDANTS(“Ohio Region”),@SHARE(@IDESCENDANTS(“Ohio Region”)))

When the shared members are checked, it tells Hyperion that you want to include shared members in the security.  The same example above, with shared members selected, would give users access to all 3 members.  The filter that gets pushed to Essbase would then look like this.

@IDESCENDANTS(“Ohio Region”)

The Workaround

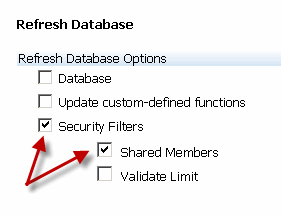
The workaround for this is to deploy the hierarchies from EPMA, and Refresh the database (security only) with Shared Members selected from Hyperion Planning.

When a patch is released, we will release the details.


Meet XWRITE, XREF’s New Big Brother

The introduction of Hyperion 11.1.2 has some fantastic improvements.  Many of these have been long awaited.  The next few articles on In2Hyperion will describe some of the enhancements to Hyperion Planning, Hyperion Essbase, and Hyperion SmartView.

XREF Background

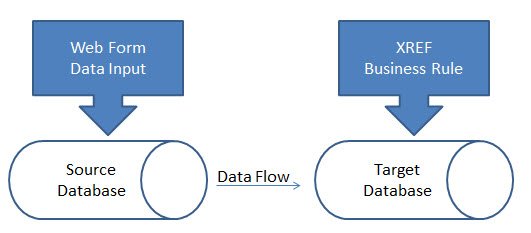
If you have been developing Planning applications, you are probably very familiar with the XREF function.  This function is used in business rules, calculation scripts, and member formulas.  It provides a method to move data from one plan type (Essbase database) to another plan type.  It is executed from the target database and pulls the data from the source.  XWRITE was actually introduced in later versions of 11.1.1.x, but is very stable in 11.1.2.x.  XWRITE is executed from the source and pushes data to the target.  This function is a huge improvement over XREF. 

XREF will copy data to a target database and must be executed from the target database.  The function pulls data rather than pushing it.  This causes two challenges.  Normally, the data is entered in the source database and is copied to the destination database.  When a Planning web form is saved, it can only execute a calculation on the database the web form is connected to (at least in older version – stay tuned).  This means an XREF function cannot be used when the form is saved.  The user has to go to another form, or execute a business rule manually, for the data to move.

The larger issue with XREF is accounting for block creation.  Remember, XREF pulls data from a source.  The destination may not have blocks that exist where the data will reside.  XREF does NOT account for the creation of the blocks if blocks don’t exist.  XREF must be used in conjunction with the CREATEBLOCKONEQUATION setting.  This is acceptable when fixing on very finite levels of data, but execution on larger amounts of data results in an extremely slow data movement process.  Essbase is responsible for the slow data movement process because it traverses all possible sparse member combinations to validate existence of data on the source.  Normally, data exists at a very small percentage of the possible blocks. In addition to the slow data movement process, it’s worth noting that the XREF function can also create blocks in your database which are unnecessary; ultimately increasing the size and decreasing the speed of your application.

Welcome to XWRITE

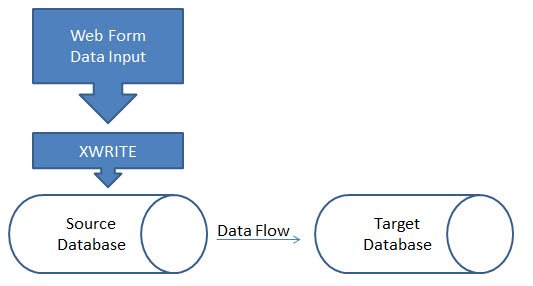
XWRITE is the opposite of XREF.  Rather than using XREF to pull the data from the target, XWRITE enables you to push data from the source.  Pushing data resolves the issues which XREF creates.

When XWRITE is executed from a web form, thus pushing data from the source to the target, there’s no longer a need to account for this process with two web forms or the manual execution of a business rule.

Since XWRITE is executed from the source, there’s no longer a need for looking at every possible sparse member combination on the target.  Using a FIX statement enables Essbase to decipher which blocks need to be copied, removing the guesswork and subsequently the requirement of CREATEBLOCKONEQUATION. Utilizating the XWRITE function results in faster processing and efficient block creation.

Prior to XWRITE, my preferred method of data movement involved exports from the source and imports to the target; thus eliminating the need for the XREF function.  The introduction of XWRITE has reduced the need for a data export/import process.


Curse You Implied Share!

Although implied shares can improve performance by not storing the same data multiple times, it has many negative impacts. For example, implied shares cause problems in Hyperion Planning at the load level (level 0).  A parent with a storage property of Stored that has one child (or only one child that consolidates) will create an implied share.  This results in level 0 members being locked, preventing web form data entry.  In Essbase/Planning, the storage method of any parent with one child has to be changed to Never Share to allow user input.

For those of you who have been snake bitten by this, you will welcome a relatively unknown Essbase configuration setting in the Essbase configuration file (essbase.cfg). 

IMPLIED_SHARE [app_name] TRUE | FALSE

An admin can now change the default behavior of how single child parents react, regardless of whether the storage type is Never Share or Stored.  This can be done for all applications on a server, or select applications.

By passing a parameter of TRUE (the default value), the parent with one child, or has only one child that consolidates to the parent, is treated as an implied share.

By passing a parameter of FALSE, the default behavior of a parent with one child acts as if it was set to Never Share.

Take advantage of this Essbase configuration setting.  Remember, when you add it to the config file, make sure the Essbase service is restarted so it will take effect.


Join Us In San Antonio!

KScope12 is the premier conference for Hyperion techies and up-and-comers. Whether you are looking to brush up on your skills, learn new skills, or see how others overcome challenges, you will want to participate in this event. If your organization values your development and has a budget for these growth opportunities, mark your calendar for June 24th through the 28th. Registration is open, and as more information is available, it will be published at In2Hyperion.

Presenting a topic is a great way to reduce the cost of the trip. It’s a great way to get your name out in the community as well. If you have something that you think would be valuable for other experts to hear about, submit an abstract.

We hope to see you there. Visit www.kscope12.com for all travel details and abstract submissions.


Why is my database growing? It’s killing my calc times!

There are times when planning and forecasting databases grow for apparently no reason at all. The static data (YTD actuals) that is loaded hasn’t changed and the users say they aren’t doing anything different.

If you load budgets or forecasts to Essbase, you probably do what I’m about to tell you. If you are a systems administrator and have never seen how finance does a budget or forecast, this might be an education.

The culprit?  More data!

Budgets and forecasts are not always completed at the bottom of the hierarchy and rolled up. I don’t mean technically, as you might be thinking, Yes they do, they load to level 0 members and it gets consolidated up the outline. When it comes to budgets and forecasts, they are largely done in a top down approach. What this means is that finance is given a goal, or number, they have to hit, and they have to PUSH it down to lower business groups. The way a financial analyst creates a top-down budget, many times, is to allocate a value based on a metric, like headcount or sales.

Assume a budget for desktop support services is required. Let’s say management has mandated that the expense doesn’t grow from last year. Since this cost is to support the people in the business, the expense is divided by the expected headcount and allocated evenly. If a business unit has 20% of the people, that unit will get 20% of the expense. Since the expense to be allocated isn’t going to change, but the headcount will, the following will be the result:

Because the analyst doesn’t want to worry about missing any changes to the headcount forecast, he or she will create a data retrieve with headcount for every cost center, whether it has headcount or not. A lock and send sheet now takes the percentage of headcount each cost center has and multiplies that factor by the total expense. As headcount gets re-forecasted, this expense has to be reallocated. With this methodology, all the user has to do is retrieve the sheet with all the headcount forecast. The math does the allocation and the result is sent back to the database.

Easy, right?

This makes a ton of sense for an accurate forecast or budget with minimal effort. Not so fast, as this has two major flaws.

First, the volume of data loaded may be drastically higher than it needs to be. Assume the worksheet has 500 cost centers (500 rows). If half of these have no headcount, there are an additional 250 blocks created that hold zeros (assuming the cost center/organization hierarchy is sparse). This method, although very efficient for updating the numbers for the analyst when headcount changes, is causing the database to grow substantially. In this isolated example, there is twice as much data than is required.

Secondly, since the data has to be loaded at level 0, the analyst thinks loading at every cost center is a requirement. The materiality of the data at this level is often irrelevant. Let’s say that the analyst is really forecasting at the region, but loading data at the cost center because it is required to be loaded at level 0. Assume there are 10 regions in which these 500 cost centers exist. A forecast at the 250 cost centers that have headcount is not required. The forecast only needs to be loaded for 10 cost centers, one for each region. If this method were used, we would only create 10 blocks, rather than the 250, or 500 originally. When the system has hundreds of users, and thousands of accounts, you can see how the size of the database would grow substantially. This also provides no additional value and huge performance problems. In the example above, the number of blocks can be reduced from 500 to 10. It is far quicker to calculate 10 blocks than 500.

Even if the data needs to be at the cost center, many times the allocation is so small, the result of the allocation is pennies, or dollars. You would be hard-pressed to find a budget where a few dollars is material. In situations like this, the users have to ask themselves if the detail is worth the performance impact.

Users, Help Yourselves

Educate your users and co-workers on the impacts of performing these types of allocations. If loading data at every cost center is required, change your formula. Rather than calculating the expense as

=headcount / total headcount * Total Expense

add an IF statement so when the retrieve has no headcount, the calculation produces a #MI,

rather than a 0. This would be more efficient

=IF(headcount=0,”#MI”, headcount / total headcount * Total Expense)

If this is not necessary, change the way the data is loaded. Rather than picking all the cost centers, retrieve the headcount from the regions and build the send template to load to one cost center for each region.

The Real World

I worked for a large financial institution with a 100 Billion dollar budget. More than 70% of all the data was less than 10 dollars, and 30% was equal to zero! The budget was never looked at below region, which was 4 levels deep in an organization hierarchy that included more than 30,000 cost centers.

After consolidating the insignificant data and educating the users, the calc times decreased from 50 minutes to less than 5. All aspects of performance were better.

Easily Find Out How This is Impacting Your Application

There are a lot of ways to see if this phenomenon impacts your database. If the database is small, the export could be loaded to Excel. With some basic IF statements, the number of cells that were higher or lower than an identified threshold could be determined. Because I regularly work in a lot of different environments with large amounts of data, I wrote an application to traverse through an Essbase export to produce statistics on the data. The application is attached for download. Make sure you have the .NET libraries installed or this will not execute.  Version 3.5 or higher is required, and can be found by searching download .net framework.  There is a good chance it is already installed.

This is a simple application that I developed quickly to help me understand the degree to which a database is impacted by the example explained above. It will traverse through roughly 25,000 lines every second, and will provide the following metrics:

  • the number and percentage of values above a threshold entered
  • the number and percentage of values below a threshold entered
  • the number and percentage of values that are 0
  • the number and percentage of values that are #Missing, or Null
  • The number of lines in the export and the number of seconds it took to process

To use this, export the database at level 0 and choose column format. You will be prompted for the path and file name of the export, and the threshold to evaluate.

Download Essbase Export Analysis, and give it a try.


This Isn’t Your Father’s Essbase Export

There are several ways to export data from Essbase on a large scale. Pulling it via Excel (Smart View or the Essbase Add-In) is not the best way to get large amounts of data when the goal is to move the data somewhere else, so this option will not be covered.

Database Export

The easiest method is to export all the data from a database by exporting the database.  This can be done in EAS.  This method is easy to automate with Maxl, but has little flexibility with formatting and the only option is to export all the data.  It can be exported in column format so the data can easily be loaded into another data repository.  If the data needs to be queried, or manipulated, this is a good option.  

Essbase Report Script

The classic way, prior to version 9, was to write a report script. This provides a tremendous amount of flexibility in formatting, but most admins struggle with this method, as it requires an in-depth knowledge of how data is most effectively queried.  If there isn’t a strong understanding, then extracting data is extremely slow.  Report scripts also offer the ability to export specific data, which is often required.

Calculation Script or Business Rule

Now, there is an alternate method that somewhat combines the best of the previous 2 methods.  A calculation script, or business rule, can now extract data in column format with a predefined column delimiter. It can filter the result to specific criteria, and doesn’t require the knowledge reports scripts does to make them efficient.

/* Export to text file */
DATAEXPORT "File" "delimiter" "fileName" "missingChar"
  
/* Export to relational database */
DATAEXPORT "DSN" "dsnName" "tableName" "userName" "password" 
  
When DATAEXPORT is used, there are a series of settings that can be applied.
  
SET DATAEXPORTOPTIONS
{
/* set the level of data to be extracted – same as a database export from EAS */
DataExportLevel ALL | LEVEL0 | INPUT;
  
/* Turning this on will export any member within the fix statement that is a dynamically calculated member that produces a value */
DataExportDynamicCalc ON | OFF;
  
/* A value between 0 and 16 – if no value is supplied, the number of decimals positions in the data, or the DataExportPrecision will be used */
DataExportDecimal n;
  
/* The number of positions numeric data is exported with, emphasizes data accuracy
NOTE: if DataExportDicimal is set, it will override this setting */
DataExportPrecision n;
  
/* When set to ON, every column will have a member name and they will be repeated from row to row */
DataExportColFormat ON | OFF;
  
/* Specifies the dense dimension used for columns – typically the months, or periods, are the most logical choice */
DataExportColHeader dimensionName;
  
/* When set to ON, the dimension names will preceed the data as column headers */
DataExportDimHeader ON | OFF;
  
/* When set to ON, data will be in column format and all members names will be repeated, and no column header will be included.  Missing and invalid data will be skipped producing successive dilimiters */
DataExportRelationalFile ON | OFF;
  
/* When set to ON, if the file specified already exists, it will be overwritten */
DataExportOverwriteFile ON | OFF;
  
/* When set to ON, the file exported will include additional details about the export
     - Summary of data export settings
    - Info, Warning, and Error messages
     - Exact number of blocks to be exported
     - Estimated time, excluding I/O time. */
DataExportDryRun ON | OFF;
};

Each method has its advantages.  I see the DATAEXPORT function becoming the primary export method because of its flexibility and ease of use.

A Word of Caution

When exporting data, always remember the population that has access to the export. Exporting data is a very popular method for backing up data, but often times it includes total company financials, employee salaries, and other sensitive data.


Data Validation Rules in Planning 11.1.2.x

Goodbye to the days of JavaScript in order to enforce data input policies and rules to Planning web forms.  With Planning version 11.1.2 and newer, Oracle has introduced a powerful set of tools for data validation within the Planning Data Form Designer itself.  Let’s walk through a scenario of how this works.

Say that we have a product mix form that will be used to input percentages as drivers for a revenue allocation.  Here’s what the form looks like:

We should expect that the sum of these percentages to be 100% at the “Electronics” parent member.  If this is not the case, the revenue allocation will incorrectly allocate data across products.  So how do we enforce this rule?  Simple… let’s take a look at the data form design.

As a row definition we’ve included two member selections; 1) Descendants(Seg01) or Descendants(Electronics) and 2) Seg01 or Electronics.  We are going to add a validation rule to row 2 of the data form.  To do this, highlight row 2 and click the sign to add a new validation rule.  Notice that in the validation rules section, it now says ‘Validation Rules: Row 2’.

The Data Validation Rule Builder will then be launched. Let’s fill in the rule.  We should ensure the Location is set to ‘Row 2’.  We’ve filled in a name and quick description, then ensured that the ‘Enable validation rule’ check box is checked.

For the rule we’ve defined some simple if logic:

IF [Current Cell Value] != [Value = 1] THEN [Process Cell] ;

To define what occurs if this condition is met we choose the ‘Process Cell’ action defined by the small gear with a letter A next to it.  Here we will highlight the cell red and notify the user with a validation message.

We click through to save the Process Cell definition and the Validation Rule itself and should now see the rule in the data form definition.

So let’s take a look at how the end user will interact with this form.  Percentages are entered by product for each month.  Upon save, notice that all months for Electronics that equal 100% appear normal.  December only sums to 90% and is highlighted in red as we specified in the data validation rule.  We cannot limit the user’s ability to save the form until the cell equals 100%; we can only notify them of the issue, and explain the cause and potential resolutions.

Of course, this is a simple example of what can be done using Planning’s Data Validation Rules.  The possibilities are endless.  Oracle has more scenario walkthroughs in the Planning Administrator’s Guide.  View them here: http://download.oracle.com/docs/cd/E17236_01/epm.1112/hp_admin/ch08.html