Curse You Implied Share!

Although implied shares can improve performance by not storing the same data multiple times, it has many negative impacts. For example, implied shares cause problems in Hyperion Planning at the load level (level 0).  A parent with a storage property of Stored that has one child (or only one child that consolidates) will create an implied share.  This results in level 0 members being locked, preventing web form data entry.  In Essbase/Planning, the storage method of any parent with one child has to be changed to Never Share to allow user input.

For those of you who have been snake bitten by this, you will welcome a relatively unknown Essbase configuration setting in the Essbase configuration file (essbase.cfg). 

IMPLIED_SHARE [app_name] TRUE | FALSE

An admin can now change the default behavior of how single child parents react, regardless of whether the storage type is Never Share or Stored.  This can be done for all applications on a server, or select applications.

By passing a parameter of TRUE (the default value), the parent with one child, or has only one child that consolidates to the parent, is treated as an implied share.

By passing a parameter of FALSE, the default behavior of a parent with one child acts as if it was set to Never Share.

Take advantage of this Essbase configuration setting.  Remember, when you add it to the config file, make sure the Essbase service is restarted so it will take effect.


Follow @EPMTechTips And Stay In Touch With Hyperion Trends

I would like to introduce a networking opportunity for all you infrastructure groupies, or those interested in the technical side of the Hyperion suite.  Follow Rob Donahue on twitter – @EPMTechTips.

From Rob:

Get useful info as it relates EPM (Hyperion) technology, particularly around infrastructure, installation & troubleshooting. Questions are welcome!

Rob Donahue is the Director of EPM Infrastructure at Rolta and specializes in infrastructure and architecture with an emphasis on Oracle EPM systems. Rob has over sixteen years of experience delivering enterprise solutions utilizing his expertise in systems architecture, performance testing, and capacity planning. He has been applying this experience to leading the successful implementation of large and complex enterprise systems including Hyperion / Oracle EPM environments. These implementations have spanned across industries and have included Fortune 250 retailers and financial services companies.


Increased Efficiency Utilizing Saved Objects in Financial Reporting

All developers understand the power of using objects during development activities, a concept that can be leveraged in the development of Oracle/Hyperion Financial Reports. Utilizing saved objects allows the development team to deliver a product in less time and provides the ability to quickly react to future report modifications. The information below (1) provides common saved object examples and (2) displays how saved objects are created and used.

What type of report information should be converted into saved objects?

The goal behind utilizing saved objects is to avoid the recreation of code, thus I find it valuable to turn all report header and footer information into saved objects. Items such as company logo’s, report title/sub-tile information, dimensional point-of-view selections, date & time stamps, page numbers and data source information make for great saved objects as they typically reside on all financial or management reports.

The usefulness of report objects may seem less important during the early stages of development, but as your reporting repository grows, their impact becomes increasingly important. For example, changing a company logo on a few reports is a minor incontinence, but making that same change to 50 reports could take hours to complete, resulting in the inefficient use of development/ maintenance time.

How are saved objects created and used?

Creating saved objects is a simple process that requires one additional step after the initial creation of your object. The example below walks through the process of creating a report title saved object. The same process will be used in the creation of all reporting saved objects.

Step 1 – Create your Object:


Step 2 – Save the Object:

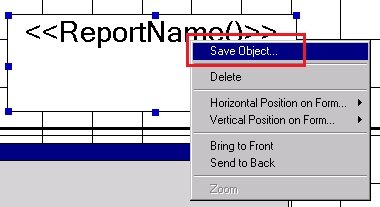
Right-click the object and select Save Object…

Best practice involves the creation of a Saved Object folder in the report repository where all saved objects will reside. Notice the use of this folder below.

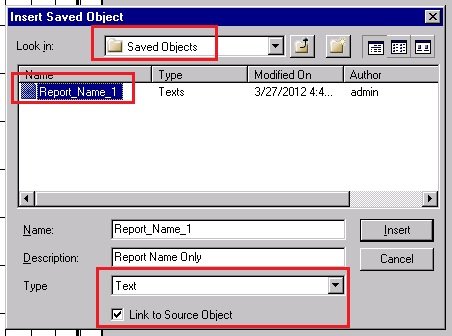
IMPORTANT – Be sure to place a checkmark next to “Link to Source Object”. This link enables future modifications of this object to resonate across all reports where this object exists. This checkbox allows for the increased efficiency when developing and maintaining reports.

Once the report has been saved, notice the object name changes.


Step 3 – Use your Saved Object:

Once the object has been saved you can reference it in future report development via the link. Create a new report and insert the saved object.


Be sure to select the Type of “Text” (It will always default to Grid) and place a checkmark next to “Link to Source Object”. 

FYI: When inserting saved objects you have 4 choices (Grid, Text, Image and Chart). Be sure to select the correct type in order to locate the desired saved object.

Note that when saved objects are inserted, they are placed in the body of the report by default; the developer will need to place the saved object in the correct position on the report.


Join Us In San Antonio!

KScope12 is the premier conference for Hyperion techies and up-and-comers. Whether you are looking to brush up on your skills, learn new skills, or see how others overcome challenges, you will want to participate in this event. If your organization values your development and has a budget for these growth opportunities, mark your calendar for June 24th through the 28th. Registration is open, and as more information is available, it will be published at In2Hyperion.

Presenting a topic is a great way to reduce the cost of the trip. It’s a great way to get your name out in the community as well. If you have something that you think would be valuable for other experts to hear about, submit an abstract.

We hope to see you there. Visit www.kscope12.com for all travel details and abstract submissions.


Managing More With Less Doesn’t Have To Be Impossible


We will always be asked to do more with less. Finance is asked to produce more and better analytics with less people. Sales people are asked to produce more in a weakening economy with less marketing dollars, and yes, groups that manage Essbase environments are asked to produce and manage more data/applications with shrinking resources.

Back in the Day

In a prior life, I used to manage a group responsible for managing the Essbase environment used to produce all the reporting for the group. It generated about 70% of the revenue for Bank One (now Chase). We delivered all the reporting, budgeting, and forecasting applications. It included nearly 2 TB of data (pre ASO) on four servers that included more than 50 databases. All the typical technologies were employed. A large number of filters existed to maintain security. Many of the applications were linked together with several types of partitions. Data was loaded daily, weekly, and monthly. SQL Server was used for all the ETL processes, and we completed the development and performed all the maintenance with four people.

The only way the group could be effective in developing and enhancing applications, was to eliminate our effort spent on typical production activities. With the number of applications and the frequency they were updated (daily, weekly, or monthly), communicating this information to the more than 250 users was also a large time commitment.

The Solution

We built custom applications using the Essbase API to not only automate the tasks, but also notify the appropriate person if there was an error. This included everything from data loads, application builds, ETL processing, nightly data exports, repetitive calculations, and every other aspect of the maintenance. We even automated the validation of the data during the load process. Data loaded to the ETL layer was compared to the ETL Export. After the data was loaded to the Essbase application, we automated Excel data retrieves and compared them back to the ETL data exports. We effectively eliminated any effort it took to maintain the environment unless an error occurred that required attention. This was the ONLY way we could keep our heads above water.

We chose the API because it is so robust. It has most of the Maxl functions. It introduces the ability to check for errors at any point in the process, and can take the appropriate steps to resolve. No manual intervention was required. The same application can interact with the ETL layer, send text messages or pages, email administrators and users, and update web pages with statuses that the users can see (like the state of the load process, calculation status, etc.).

This solution may be overkill for very small implementations of one or two applications. But, don’t underestimate its importance in medium to large-scale operations. It minimizes costs, reduces errors, provides a better user experience, and minimizes delays in new development.

I highly recommend investigating how this would work for your group. Although I used the Visual Basic API, there are also libraries for C and Java.


What’s New with Smart View

The newest release of Smart View (Release 11.1.2.1.102) includes many helpful, long-awaited features sure to both enhance the end-user experience and increase productivity. Many of the new features are examined below while a complete list and their descriptions can be found here.

Ad Hoc Operations in Multiple Cells

Previous versions of Smart View limited users to cell level ad-hoc operations. For example; say you wanted to ‘Zoom In’ on a member, Smart View limited this action to a single cell (single member). The newest version allows users to select a range of cells before performing an action allowing for quicker answers. Multi-cell actions such as Zoom In, Zoom Out, Keep Only and Remove Only are now permitted.  

Member Information

End users of Smart View often struggled to find additional information pertaining to members of a dimension from which they queried. This problem has been remedied with the new ‘Member Information’ button located in the Essbase ribbon. When focused on a single Essbase member, users can click the Member Information button and be presented with multiple member properties such as:

  • Dimension Name
  • Member Level
  • Member Generation
  • Parent/Child Name
  • Consolidation Operator
  • Alias Tables
  • Alias Names
  • Attributes
  • Formulas
  • Comments
  • User Defined Attributes (UDAs)

Linked Objects

End users with proper access can now add/ access ‘Linked Reporting Objects’ and ‘Linked Partitions’. Having Linked Reporting Object access allows for cells notes, external files and URLs to be linked to Smart View data cells for reference. Access to Linked Partitions enables connection between 2 separate databases. This allows users to navigate database ”A” while connected to database “B”, opening up additional data analysis opportunities.

Displaying Member Names and Aliases

Previous versions of Smart View generated a common complaint centered on the display of member names versus aliases. Essbase and Planning users familiar with the Essbase Add-In were accustomed to displaying both member names and aliases in a retrieve. These users had become frustrated by Smart View’s inability to function similarly. This problem has been fixed with Oracle’s latest release whereas users now have the option to display member names and their aliases, side-by-side, on retrieves.

POV Toggle

The ‘POV Toggle’ button allows end-users the ability to move dimensions from the Smart View POV Toolbar to row one, thus placing all dimensions on the grid. Users familiar with the Essbase Add-In will appreciate this functionality, allowing ‘power users’ quicker retrieve setup times. This can easily be switched back with the click of the POV Toggle button.

Sheet Level Options

Previously, all Smart View specified Options were global in nature. Options found in the ‘Options’ dialog box including ‘Member Options’, ‘Data Options’ and ‘Formatting Options’ are now sheet specific, allowing for multiple sheets to function with their own definitions. This means ‘Sheet 1’ could drill to the bottom level and display only member names while ‘Sheet 2’ could drill to the next level and display the combination of member name and alias. Note that options found in ‘Advanced Options’, ‘Cell Styles’ and ‘Extensions’ remain global in nature.

Butterfly Reporting

One of the commonly used features of Financial Reporting involves the use of ‘Butterfly’ reporting. Butterfly reports display a column of dimensional members between two columns of data.

New Zoom Options

Users now have additional ‘Zoom’ options including:

  • Same Level
  • Sibling Level
  • Same Generation
  • Formulas (retrieve data for all members that are defined by the formula of the selected member)

Submit Data without Refreshing

Gone is the requirement to refresh a grid prior to submitting data while in Free-Form mode.


As noted above, this review includes many, but not all new features released with Smart View 11.1.2.1.102. Please visit Oracle for a complete list and description of each new feature.


Is Your Message Getting Ignored?

Think about how many emails you delete without reading. Your inbox gets cluttered with specials from your favorite stores that you requested to be sent.  You just but didn’t realize a new email would show up every other day. Everyone has the friend who sends emails that he or she thinks is so funny that aren’t. There’s also the person who seems to update his status multiple times a day and “checks in” at the grocery store, work, dinner, etc. Sometimes it’s your system administrator sending you updates about every aspect of the system that you delete. Then you think, Wait, I am the administrator. My emails are always read!  Right?

Are You That Friend?

Well, I hate to tell you, but to your users, you may be the “that” friend. You may be the one telling them what time you woke up, when you got to work, and where you ate dinner.  You may be on the dreaded auto delete list.  Your email might be the email that triggers the twitch and the water cooler comments.  The big question is, What happens to that one important email out of the 20 you send?

How To Remove Yourself From The Auto-Ignore List

If you are a system administrator, it’s critical that you filter the information to your users to minimize the irrelevant communication.  Not all your users require the same information.  Here are some suggestions that may improve your communication and limit the frustration of your user population.

  1. Only send out global communications when it is appropriate.  If only one of your servers will be impacted, make sure only the users that will be impacted are notified.
  2. If you have more than one application, create a distribution list for each one.  This will ensure that relevant information is sent to the appropriate users.
  3. If you have users with different responsibilities, make sure you separate those responsibilities.  If information is sent out about when the system will be open to change a budget or forecast, only inform those that have the ability to make those changes.
  4. Let your users choose what they are notified about.  If you have a list of topics that are typically communicated, let your users decide which email groups they associated with.

When developing this methodology, use careful consideration about your approach.  For environments including only a few applications and a small population of users, don’t try a multi-tiered solution.  A spreadsheet would likely meet your needs.  For environments that are larger, think about the implications of managing these lists with a lot of applications and hundreds of users. Managing offline lists could become a job in itself, and become outdated and useless over a short period of time.

A Thought

Prior to consulting, I managed a fairly large environment.  We had more than 250 users and 10 to 20 applications.  They ranged from field headcount reporting, to home office budgeting and forecasting.  The approach I used was not complicated, it was easy to setup, and it gave the users all the control in deciding what they received.  A relational database was created to hold the distribution lists, users, and their emails.  Users could access this from a website (one asp/.net web page) that allowed them to enter their email, return the topic groups they are associated with, and allow them to change it in real-time.  Any time a new distribution group was added, a global email was sent out notifying everyone of the addition.  Email distributors (in our case, the system administrators), could use this website to send out emails by selecting which groups should be notified.

Happy Customers

This approach above took less than a day to create.  It significantly reduced the frustration from the user population. They only received emails they wanted to receive, they were aware of the different types of communication, and THEY controlled the amount of communication they received.  By empowering them, critical information was far less overlooked.


Why is my database growing? It’s killing my calc times!

There are times when planning and forecasting databases grow for apparently no reason at all. The static data (YTD actuals) that is loaded hasn’t changed and the users say they aren’t doing anything different.

If you load budgets or forecasts to Essbase, you probably do what I’m about to tell you. If you are a systems administrator and have never seen how finance does a budget or forecast, this might be an education.

The culprit?  More data!

Budgets and forecasts are not always completed at the bottom of the hierarchy and rolled up. I don’t mean technically, as you might be thinking, Yes they do, they load to level 0 members and it gets consolidated up the outline. When it comes to budgets and forecasts, they are largely done in a top down approach. What this means is that finance is given a goal, or number, they have to hit, and they have to PUSH it down to lower business groups. The way a financial analyst creates a top-down budget, many times, is to allocate a value based on a metric, like headcount or sales.

Assume a budget for desktop support services is required. Let’s say management has mandated that the expense doesn’t grow from last year. Since this cost is to support the people in the business, the expense is divided by the expected headcount and allocated evenly. If a business unit has 20% of the people, that unit will get 20% of the expense. Since the expense to be allocated isn’t going to change, but the headcount will, the following will be the result:

Because the analyst doesn’t want to worry about missing any changes to the headcount forecast, he or she will create a data retrieve with headcount for every cost center, whether it has headcount or not. A lock and send sheet now takes the percentage of headcount each cost center has and multiplies that factor by the total expense. As headcount gets re-forecasted, this expense has to be reallocated. With this methodology, all the user has to do is retrieve the sheet with all the headcount forecast. The math does the allocation and the result is sent back to the database.

Easy, right?

This makes a ton of sense for an accurate forecast or budget with minimal effort. Not so fast, as this has two major flaws.

First, the volume of data loaded may be drastically higher than it needs to be. Assume the worksheet has 500 cost centers (500 rows). If half of these have no headcount, there are an additional 250 blocks created that hold zeros (assuming the cost center/organization hierarchy is sparse). This method, although very efficient for updating the numbers for the analyst when headcount changes, is causing the database to grow substantially. In this isolated example, there is twice as much data than is required.

Secondly, since the data has to be loaded at level 0, the analyst thinks loading at every cost center is a requirement. The materiality of the data at this level is often irrelevant. Let’s say that the analyst is really forecasting at the region, but loading data at the cost center because it is required to be loaded at level 0. Assume there are 10 regions in which these 500 cost centers exist. A forecast at the 250 cost centers that have headcount is not required. The forecast only needs to be loaded for 10 cost centers, one for each region. If this method were used, we would only create 10 blocks, rather than the 250, or 500 originally. When the system has hundreds of users, and thousands of accounts, you can see how the size of the database would grow substantially. This also provides no additional value and huge performance problems. In the example above, the number of blocks can be reduced from 500 to 10. It is far quicker to calculate 10 blocks than 500.

Even if the data needs to be at the cost center, many times the allocation is so small, the result of the allocation is pennies, or dollars. You would be hard-pressed to find a budget where a few dollars is material. In situations like this, the users have to ask themselves if the detail is worth the performance impact.

Users, Help Yourselves

Educate your users and co-workers on the impacts of performing these types of allocations. If loading data at every cost center is required, change your formula. Rather than calculating the expense as

=headcount / total headcount * Total Expense

add an IF statement so when the retrieve has no headcount, the calculation produces a #MI,

rather than a 0. This would be more efficient

=IF(headcount=0,”#MI”, headcount / total headcount * Total Expense)

If this is not necessary, change the way the data is loaded. Rather than picking all the cost centers, retrieve the headcount from the regions and build the send template to load to one cost center for each region.

The Real World

I worked for a large financial institution with a 100 Billion dollar budget. More than 70% of all the data was less than 10 dollars, and 30% was equal to zero! The budget was never looked at below region, which was 4 levels deep in an organization hierarchy that included more than 30,000 cost centers.

After consolidating the insignificant data and educating the users, the calc times decreased from 50 minutes to less than 5. All aspects of performance were better.

Easily Find Out How This is Impacting Your Application

There are a lot of ways to see if this phenomenon impacts your database. If the database is small, the export could be loaded to Excel. With some basic IF statements, the number of cells that were higher or lower than an identified threshold could be determined. Because I regularly work in a lot of different environments with large amounts of data, I wrote an application to traverse through an Essbase export to produce statistics on the data. The application is attached for download. Make sure you have the .NET libraries installed or this will not execute.  Version 3.5 or higher is required, and can be found by searching download .net framework.  There is a good chance it is already installed.

This is a simple application that I developed quickly to help me understand the degree to which a database is impacted by the example explained above. It will traverse through roughly 25,000 lines every second, and will provide the following metrics:

  • the number and percentage of values above a threshold entered
  • the number and percentage of values below a threshold entered
  • the number and percentage of values that are 0
  • the number and percentage of values that are #Missing, or Null
  • The number of lines in the export and the number of seconds it took to process

To use this, export the database at level 0 and choose column format. You will be prompted for the path and file name of the export, and the threshold to evaluate.

Download Essbase Export Analysis, and give it a try.


This Isn’t Your Father’s Essbase Export

There are several ways to export data from Essbase on a large scale. Pulling it via Excel (Smart View or the Essbase Add-In) is not the best way to get large amounts of data when the goal is to move the data somewhere else, so this option will not be covered.

Database Export

The easiest method is to export all the data from a database by exporting the database.  This can be done in EAS.  This method is easy to automate with Maxl, but has little flexibility with formatting and the only option is to export all the data.  It can be exported in column format so the data can easily be loaded into another data repository.  If the data needs to be queried, or manipulated, this is a good option.  

Essbase Report Script

The classic way, prior to version 9, was to write a report script. This provides a tremendous amount of flexibility in formatting, but most admins struggle with this method, as it requires an in-depth knowledge of how data is most effectively queried.  If there isn’t a strong understanding, then extracting data is extremely slow.  Report scripts also offer the ability to export specific data, which is often required.

Calculation Script or Business Rule

Now, there is an alternate method that somewhat combines the best of the previous 2 methods.  A calculation script, or business rule, can now extract data in column format with a predefined column delimiter. It can filter the result to specific criteria, and doesn’t require the knowledge reports scripts does to make them efficient.

/* Export to text file */
DATAEXPORT "File" "delimiter" "fileName" "missingChar"
  
/* Export to relational database */
DATAEXPORT "DSN" "dsnName" "tableName" "userName" "password" 
  
When DATAEXPORT is used, there are a series of settings that can be applied.
  
SET DATAEXPORTOPTIONS
{
/* set the level of data to be extracted – same as a database export from EAS */
DataExportLevel ALL | LEVEL0 | INPUT;
  
/* Turning this on will export any member within the fix statement that is a dynamically calculated member that produces a value */
DataExportDynamicCalc ON | OFF;
  
/* A value between 0 and 16 – if no value is supplied, the number of decimals positions in the data, or the DataExportPrecision will be used */
DataExportDecimal n;
  
/* The number of positions numeric data is exported with, emphasizes data accuracy
NOTE: if DataExportDicimal is set, it will override this setting */
DataExportPrecision n;
  
/* When set to ON, every column will have a member name and they will be repeated from row to row */
DataExportColFormat ON | OFF;
  
/* Specifies the dense dimension used for columns – typically the months, or periods, are the most logical choice */
DataExportColHeader dimensionName;
  
/* When set to ON, the dimension names will preceed the data as column headers */
DataExportDimHeader ON | OFF;
  
/* When set to ON, data will be in column format and all members names will be repeated, and no column header will be included.  Missing and invalid data will be skipped producing successive dilimiters */
DataExportRelationalFile ON | OFF;
  
/* When set to ON, if the file specified already exists, it will be overwritten */
DataExportOverwriteFile ON | OFF;
  
/* When set to ON, the file exported will include additional details about the export
     - Summary of data export settings
    - Info, Warning, and Error messages
     - Exact number of blocks to be exported
     - Estimated time, excluding I/O time. */
DataExportDryRun ON | OFF;
};

Each method has its advantages.  I see the DATAEXPORT function becoming the primary export method because of its flexibility and ease of use.

A Word of Caution

When exporting data, always remember the population that has access to the export. Exporting data is a very popular method for backing up data, but often times it includes total company financials, employee salaries, and other sensitive data.