Navigating Misaligned Menus in Workspace with IE8


If you have recently upgraded your web browser to IE8 and attempted to use Hyperion Workspace, you’ve likely encountered difficulty in navigating the interface. When a user clicks on the wheel in the upper left hand corner, selects “Applications,” they can’t see the menu as it apearrs to be condensed. 


This issue can be quickly resolved by making a browser modification to the IE security. It is best to run this settings change past your IT department to ensure it will not open holes in your company’s security profile.


To correct this issue, 


1.       Open IE8


2. 

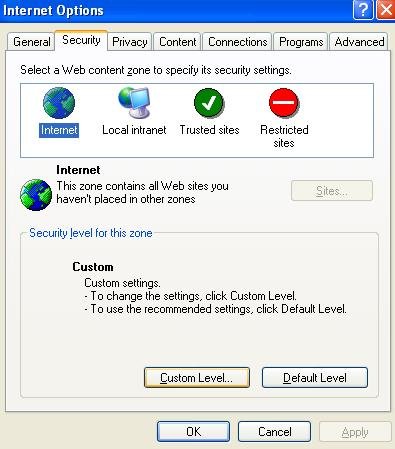
3.       Select the “Security” tab and “Custom Level”.


4.       You will have 4 zones where security changes can be performed (Internet, Local Internet, Trusted sites, Restricted sites). The change can be made to each of these 4 zones if necessary, but it’s possible only one zone needs modified. Test the combination that works for your environment and fits your companies IT/security profile.


5.       Select the “Internet” zone and scroll down the menu of options to find “Allow script-initiated windows without size or position constraints”. This will likely be set to “Disable”… select “Enable” and click “OK”. (If prompted, accept the change just made to the zone security).


6.       Select “OK” from the security tab to finalize the modification.


7.       Test the modification to verify the change worked as intended. As noted above, you might need to enable this setting on multiple zones in order for the setting to take effect.


Why Does Workspace Log You Out?

Many clients have issues with Workspace logging users out when attempting to open/export certain types of documents. For example, a user logged into Hyperion Workspace attempts to open a Supporting Detail document, only to be prompted with a logout warning message before the document opens. The same can happen when a user attempts to export an FR report file (.DES file) from Workspace. After being logged out of Workspace, the user is able to log back into the application and open/export the necessary document. This issue can easily fixed by adjusting a few browser settings as shown below.

NOTE: Microsoft documents typically cause this logout issue (Excel, Word, PowerPoint).

1. Open your web browser (This blog entry will assume IE).

2. Select “Tools” -> “Internet Options…” from the menu bar.

3. Select the “Internet” option inside the “Security” tab. Select “Custom Level…”.

4. Navigate to the “Downloads” section and “Enable” Automatic prompting for file downloads. Click “OK”.


5. Now select the “Local Internet” option inside the “Security” tab. Select “Custom Level…”.


6. Navigate to the “Downloads” section and “Enable” Automatic prompting for file downloads. Click “OK”.


7. Finally, select the “Trusted sites” option inside the “Security” tab. Select “Custom Level…”.


8. Navigate to the “Downloads” section and “Enable” Automatic prompting for file downloads. Click “OK”.

9. Now that the settings have been set properly, Click “OK” on the “Internet Options” dialog box.

10. Close and re-open your web browser for the settings to take effect. Test these settings by logging into Workspace and opening a Supporting Detail document.


Adding Font Types in Financial Reporting

The ability to import font types into Hyperion Financial Reporting is a common request by many companies, typically a request resulting from corporate reporting standards. Not only is this possible, it’s a quick and easy exercise that is detailed out below.

Step 1: Locate the Font Folder.

The font type files (normally identified by a .TTF or .ttf extension) can be found in the “Fonts” folder located in your Windows directory (Likely on your ‘C’ drive). The key here is locating this folder on the server where Hyperion Financial Reporting has been installed.

Step 2: Copying& Pasting the New Font File.

This is as easy as it sounds… just copy and paste the new file into this directory.

Step 3: Creating a Report.

Opening Hyperion Financial Reporting and create/modify a report. When selecting the font type, notice the new Font Type that was just added in Step 2 above. Note that it’s best to close the Financial Reporting client before importing the new Font file onto the server; this will insure that the client will recognize the new file.


Financial Reporting – Bottom 10 KPI

Reporting solutions often require companies to filter out a top range of Key Performance Indicators; for example, the top 10 expenses related to marketing. Hyperion Financial Reporting makes this type of reporting easy for developers by providing the “Top” properties checkbox. The difficulty arises when a company requires a solution to display the bottom 10 – those 10 expenses that account for a majority of marketing related expense. Hyperion Financial Reporting has nothing built to provide this type of information.

As you might expect – knowing your smaller expenses is important but knowing the largest; those where you can improve margin, is vital. A solution to display the bottom 10 is detailed below; this solution displays the 10 largest negative values vs. displaying the 10 largest positive values.

The high-level solution includes the following functionality:
a.    Inserting a “Rank” column.
b.    Sorting on the “Rank” column.
c.    Adding conditional suppression for bottom 10.

Step 1:

Create a report grid with a formula column as the first column (Column A below).


Step 2:

Insert the “Rank” function on the Formula Column. Be sure to choose the “Ascending” property. Adding “Rank” will order the rows from High-to-Low based on the data returned. The example below provides ranking off of Column ‘A’. The ranking is used on Step 4 when adding conditional suppression.

Step 3:

Apply row “Sort” to the grid. You find the “Sort” property by placing focus on the entire grid (left clicking the upper left-most cell). Choose to apply sorting to the “Rows”, Sort by “Column A”, and sort in “Ascending” order. Sorting will determine the order in which the data is displayed, Ascending or Descending. The Sorting is used on Step 4 when adding conditional suppression.

Step 4:

Add Conditional Suppression to the row(s). This logic will determine which data rows are ultimately displayed to the user. To add conditional suppression, highlight the row and click “Advanced Options”. Because the requirement is to show the bottom 10, suppression should hide any row with a “Rank” value greater than 10 (You will also want to suppress rows where “No Data” is returned).

When this report is run, only the bottom 10 will be displayed to the user… those marketing expenses with the largest negative values. The solution above will essentially do what a “Bottom” checkbox would have provided had Hyperion programmed this functionality into the application.


Financial Reporting with Rolling Years and Periods (Step 4 of 4)

Step 4: Adding ‘Advanced Suppression’ to each of the Year & Period columns.

Step 4 in the development of this report contains a majority of the logic to be setup which will allow a range of periods to be displayed to users. The idea behind the logic in this section is to move the range of periods displayed to users based on the Period selected in the User POV. The “Range Matrix” below will shed some light on what should be displayed based on what is selected.

Just as Conditional Suppression was setup for the trigger columns, Conditional Suppression will need setup for these Year/Period columns. The difference between the “Trigger” section and the “Year/Period” section resides on how columns are chosen to be suppressed. As the name suggests, the “Trigger” section added in steps 1 & 2 will drive the conditional logic, and thus the range of Periods displayed to users. The examples below display a high-level subset of the column logic.

Example 1:

  • User selects “Jan” as the Period.
    • Which Periods will be displayed?
    • Sep (Prior Year)
    • Oct (Prior Year)
    • Nov (Prior Year)
    • Dec (Prior Year)
    • Jan (Current Year)
    • Which Periods will be hidden (suppressed)?
    • Feb-Dec (Current Year)


Example 2:

  • User selects “Sep” as the Period.
    • Which Periods will be displayed?
    • May (Current Year)
    • Jun (Current Year)
    • Jul (Current Year)
    • Aug (Current Year)
    • Sep (Current Year)
    • Which Periods will be hidden (suppressed)?
    • Sep-Dec (Prior Year)
    • Jan-Apr (Current Year)
    • Oct-Dec (Current Year)


When adding columns to a report, each column will be tagged with an alphanumeric value that identifies the column number. Staying true to the rolling 5-month solution, columns “A” through “L” of your report identify the “Trigger” section (Jan equals “A”, Feb equals “B”… Dec equals “L”). The “Year & Period” section is identified by columns “M” through “AB” of your report (Sep of Prior Year equals “M”, Oct of prior year equals “N”… Dec of current year equals “AB”). When setting up the “Year & Period” Conditional Suppression, it is imperative that you know and understand which Periods correlate to which column numbers.

“Trigger” Section:

“Year & Period” Section:

The Conditional Suppression will need added to all “Year & Period” section columns (columns “M” through “AB” in the above images). Column “M” (which correlates to “Sep” of prior year) will need displayed to the user ONLY when the user selects “Jan” for the current POV of the Period dimension. By selecting “Jan”, the user is requesting to see data for Sep-Dec of the Prior Year, and Jan of the current year (as shown above in the “Range Matrix”). A subset of the Hyperion Reporting logic is shown in the image below. Similar logic is required for the remaining columns of the “Year & Period” section (columns “N” through “AB”) with the only difference being the suppressed “Trigger” columns selected.

Hyperion Reporting – Conditional Suppression Logic:


Year & Period Suppression Logic:


As stated before, the “Trigger” section of the report drives what is ultimately displayed to the user, and this is based on what the user selects in the User POV for Period. If a report requirement exists for something other than a 5-month rolling view, the number of “Year & Period” section columns would need adjusted, as would the Conditional Suppression logic, but the “Trigger” section will not need adjusted. The overall idea of how to implement this solution remains intact. Please feel free to contact me directly with any questions on implementing a solution such as this, I’m happy to assist when possible.


Financial Reporting with Rolling Years and Periods (Step 3 of 4)

Step 3:  Adding Year and Period columns.

The columns added here will be those which are displayed to the users. The Trigger section added in steps 1 and 2 above will determine which range of Periods will ultimately be displayed to the users. The key to adding columns in this section of the report is to include ALL possible Periods that could be displayed to the end-user. The Trigger section of the report will essentially move & display a subset range of Periods. For example, If a user selected “Jan” as their current Period, The report will need to display Sep-Dec of the prior year.

Keys:

  • These columns will be those displayed to the end-users.
  • These columns MUST be Data columns.
  • A rolling 5-month report will display Sep, Oct, Nov, Dec and Jan IF Jan is selected by the end-user.
  • Either ‘Substitution Variables’ or the ‘RelativeMember’ function can be utilized for the Year dimension (ie. CurrentYear, CurrentYear-1, etc.).
  • The Period members can be “hard-coded” into the report (don’t use the POV Period option here).


Financial Reporting with Rolling Years and Periods (Step 2 of 4)

Step 2: Adding ‘Advanced Suppression’ to each of the 12 Trigger columns.

The Conditional Suppression set on each of these columns (see Step 1) will suppress the column that correlates to the Period selected. If the end-user selects Jan, then the column representing Jan will be suppressed. This is used later in step 4 of the report development.

Keys:

  • The Advanced (Conditional) Suppression for each column relates to the 12 Periods added in Step 1.
  • The logic for Jan is as follows:
    • Suppress Column If:
      • “Member Name” “Period” “equals” “Jan”.
      • “Jan” is the actual member name.
  • The same logic in place for Jan will be required for the Feb-Dec columns, Thus…
    • Suppress Column If:
      • “Member Name” “Period” “equals” “Feb”.
      • “Feb” is the actual member name.
      • Etc…
  • Once steps 1 & 2 are complete, development of the trigger section has been finished.


Financial Reporting with Rolling Years and Periods (Step 1 of 4)

If you have worked with Hyperion Financial Reporting, odds are good that you’ve come across report requirements for Rolling Years and Periods, that is to say a report that spans periods from multiple years. This is an easy build if your data source includes a single “rolling” dimension for ‘Year’ and ‘Period’ – you utilize the “RelativeMember” function to move up or down the hierarchy. The difficulty arises when programming this same logic into a report with separate ‘Year’ and ‘Period’ dimensions. A solution utilizing “Trigger” columns is shown below.

The use of what I call trigger columns allows for Hyperion Financial Reporting to display rolling Years and Periods, whether your requirement is for a 2 or 12 month rolling report. The Trigger section of the report requires both the ‘Year’ and ‘Period’ dimension to be columns on the report, while any dimension; such as Account or Product, can be included on the rows. The steps below detail a rolling 5-month solution.

Step 1:  Add data columns for all 12 periods (Jan-Dec).

These columns will function as the Trigger section, essentially telling the other columns what the end-user selected for Period. This is important because later sections of the report require knowledge of the selected Period to ultimately decide what is displayed.

Keys:

  • These 12 columns MUST be Data columns.
  • These 12 columns MUST be hidden.
  • The Period member selection MUST be set to “Current Point of View for Period”.
  • The Year member can be any member – not relevant to the trigger.

  • Optional: Overwrite the Period POV cell with the 12 periods (Jan-Dec) as shown below.


Hyperion Essbase Product Overview

Overview

Essbase is widely considered to be the industry leading OLAP (On-Line Analytical Processing) server. Built on a real-time analytic infrastructure, Essbase provides BI and EPM users the ability to quickly dissect and analyze data through an intuitive interface.  Essbase end-users have multiple options for interacting with data including Microsoft Excel, Hyperion Financial Reporting and Hyperion Web Analysis. By bringing Essbase together with other Oracle applications, users will find broad support for demanding business requirements.  Breaking down large datasets, working with best-case/worst-case scenarios, forecasting multi-line expenses, and reporting variance analysis is now at your fingertips. Essbase ultimately allows end-users to interact and analyze real-time data through an integrated, rapid-response, and secure environment.

Product History

Arbor Software Corporation, an OLAP software company that designed and marketed multidimensional database software for planning and analysis, developed Essbase (Extended Spreadsheet Database), first branded “Arbor Essbase” in 1992. This multidimensional database product was originally developed to address the scalability problems associated with spreadsheets like Microsoft Excel and Lotus 1-2-3.

In 1998, Hyperion Software Corporation, a company with packaged analytic applications specializing in financials, and Arbor, merged to become Hyperion Solutions Corporation. Their first assignment after the merger was obvious, integrating Essbase with Hyperion Pillar, Hyperion Enterprise, and Hyperion Reporting.

After the merger, Essbase became the backbone to a full suite of applications for planning & budgeting, financial consolidations, scorecards, reporting, and more. Hyperion Solutions become a leader in the world of performance management software with Essbase leading the way.

In 2007, Oracle purchased Hyperion Solutions. At the time of the acquisition, Hyperion applications were being used by approximately 12,000 companies, including 91 of the Fortune 100. The acquisition made Oracle a leader in the EPM (Enterprise Performance Management) market and strengthened the Oracle offerings.

Strengths / Benefits