Using a Shared Connection with HSGetValue/HSSetValue with Planning or PBCS

If you are a fan of the HSGetValue and HSSetValue, you probably are using a private connection. As you know, anybody that uses the template has to either change the connection string to their own predefined private connection, or set up a private connection with the same name. When dealing with inexperience users, both methods can be problematic.

You may be surprised to know that the Get and Set Value functions can use a shared connection. Rather than using the private connection name, the following can be specified to use a shared connection in place of the private connection name.

Private connection syntax:
HsGetValue(“PrivateConnectionName”,”POV”)
HsSetValue (dollar amount,”PrivateConnectionName”,”POV”)

Shared connection syntax:

HsGetValue(“WSFN|ProviderType|Server|Application|Database”,”POV”)
HsSetValue (dollar amount,”WSFN|ProviderType|Server|Application|Database”,”POV”)

Parameter Summary

  • “WSFN” is a static string and never changes
  • The provider type for planning is “HP” regardless of whether the server is a cloud server or on premise server
  • The server specifies the location of the server housing the application. For PBCS, use the URL provided by Oracle (planning-test-domain.pbcs.us2.oraclecloud.com)
  • The application is the application name
  • The database is the plan type, or database name

Put that all together and the string looks like this.
WSFN|HP|planning-test-A12345.pbcs.us2.oraclecloud.com|Finance|Revenue

Conclusion

Although there are a few drawbacks to using a shared connection (users could use the wrong connection and not get the expected result), my experience has been that the pros (no setup of private connections, can be used in multiple environments without changing anything, etc.) far outweigh the cons.


Password Encryption – Business Rule Batch Files

I recently learned the importance of encrypted passwords in batch files. Without a password file, the scripts will still run, but the user is prompted to input a password in the command prompt after initialization. Encrypted passwords allow for the automation of these scripts. Shout out to Sumit Deo for his patience in guiding me through the initial process and helping me with my batch scripting skills along the way.

From Oracle’s documentation, a password file in business rule batch files is optional.

However, when executing the batch, the user will be prompted to input the password:

In order to automate this batch file, the password file becomes a necessity. We could put the password in a .txt file and reference that, but for security purposes it makes more sense to encrypt the password. To create an encrypted password, use the “PasswordEncryption.cmd” Windows command file which is located at D:\Oracle\Middleware\user_projects\foundation1\Planning\planning1

In this folder, create a new folder called Password and save a blank notepad file titled Password.txt. Next, open up a command prompt and enter the following command (the first half calls the password encryption file & the 2nd half is the path and file name where the encrypted password will be saved:

D:\Oracle\Middleware\user_projects\foundation1\Planning\planning1\PasswordEncryption.cmd D:\Oracle\Middleware\user_projects\foundation1\Planning\planning1\Password\password.txt

Upon hitting enter, the screen will prompt for a password to be encrypted. Type in the password (nothing will appear on the screen) and hit enter again.

The screen will display as follows, noting that the password has been encrypted to the desired location & file:

Check the password file for the encrypted password:

The next step is to include the encrypted password into the business rule batch file, so that the rule will run automatically when called from the script. The syntax for the command is as follows:

CalcMgrCmdLineLauncher.cmd [-f:passwordFile] /A:appname /U:username /D:database [/R:business rule name | /S:business ruleset name] /F:runtime prompts file [/validate]

We will be focusing on the -f:passwordFile portion of the command. To specify where the encrypted password is stored, -f:passwordFile becomes:

The %CALCLAUNCHER% variable is equal to D:\Oracle\Middleware\user_projects\foundation1\Planning\planning1

Now that the encrypted password has been inserted into the command line of the business rule batch file, the batch will run to completion without stopping to ask the user to input a password. This comes in very handy when attempting to automate multiple tasks in one batch script.


FR Studio: How to Select Level 0 Descendants of a Specific Member

This post looks at the “Allow Expansion” functionality in Financial Reporting Studio. “Allow Expansion” is a great feature, as it gives the user more flexibility when running and displaying reports. However, it can also require more setup work as it makes the report more complex. Two situations that I encountered recently:

  1. Adding a custom heading using conditional formatting
  2. Calculating formulas on expanded members

1) Adding a Custom Heading Using Conditional Formatting

For this example, I want to rename the account “PROMO”, to “Promotions” in the report. Typically, this setting can be changed by clicking on the “PROMO” cell and then editing the Custom heading in the properties box. However, with expansion enabled, the result will be that the member and its children will be renamed to “Promotions” with expansion enabled.

To demonstrate this, first we must enable expansion.  Highlight the entire row by clicking on the desired row number. Check the box next to “Allow Expansion” in the “Heading Row Properties” box. When expansion is enabled we will see that the custom heading will appear for all descendants of “PROMO”.

Run the report in the HTML preview, and click the arrow next to “Promotions” to see the children of the account. Notice in the screenshot below that both children now display as “Promotions”. How can we edit this so that the Custom heading only appears for “PROMO”, and not its children? This is where conditional formatting comes into play

The desired outcome is that both children will display their unique name as is stored in the dimension library. In order to accomplish this, some additional conditional formatting needs to be set up within the report:

The report needs to be given instructions on when to apply the custom heading. To apply this setting, we need to know what level or generation the account is, so that the rule will tell FR only to apply the custom heading on that specific account. For example, looking at the account structure below, “PROMO” is a Generation 7/Level 1 member of the hierarchy. We want the custom heading to only display for this level (i.e. “PROMO”) and allow the Generation 8/Level 0 members (i.e. children of “PROMO”) to display as usual.

The following 2 screenshots are examples of possible conditional formats for the member (based off the hierarchy above). Either of the 2 will work.

Select “Format Cells” and select the “Replace” tab. Enter in “Promotions” and click OK. After setting the conditional format, go ahead and run the report in HTML Preview again (Allow Expansion only works in HTML Preview, not in PDF Preview)

Expand on “Promotions” and notice the difference in formatting from before. The children will be displaying their unique member names as expected:

That took care of our first problem – How to set Custom Headings on Allow Expansion members using conditional formatting. Next up…

2) Dynamically Calculating using Allow Expansion

Another issue I encountered was that calculations didn’t update upon expansion of members. We’ll focus on the highlighted cell below to solve this issue:

The formula is a simple calculation, “PROMO”/”GROSS_SALES” or [A,3]/[A,2]:

When expanded, I want the calculation to update to show the relevant values for the children of “PROMO” i.e. the children will display as a percentage of “Gross Sales”. However, the values are static and do not update as expected. Notice that the 19.7% repeats itself for “Promotions” and its 2 children in the screenshot below. It seems that by hardcoding the formula to specific cells ([A,3] & [A,2]), the report only calculates “Promotions” / “Gross Sales”, instead of recalculating for the 2 children upon expansion (“425000/”Gross Sales” & “425040”/”Gross Sales”):

Rather than locking the numerator in place by selecting [A,3], we can improve the report by switching this value to reference the entire column [A]. Edit the formula by highlighting column B and typing the new formula into the formula box at the top of the report.

The new formula should look like this:

Instead of hardcoding the formula to one cell, the formula now has more flexibility for expanding members. Notice that the values calculate dynamically upon expansion this time around:

Overall, “Allow expansion” is a beneficial feature that allows users more flexibility with their reporting needs, but it sometimes takes a little more maneuvering to get the reports to display as expected.


ZipLogs Utility

OK, I have opened up a ticket with Oracle.  Now, they want my logs.  Frustration sets in, and I wonder…how long is it going to take to figure out where they all are and which ones are important?  If I miss one, my resolution will surely get delayed. This is all I need!

In newer versions of the Hyperion environment, Oracle has made some huge improvements.

First, the logs are much more centralized.

  • The installation logs are now located in EPM_ORACLE_HOME/diagnostics/logs.
  • The configuration, service startup, and runtime logs for all the service components are in EPM_ORACLE_INSTANCE/diagnostics/logs.
  • The web application runtime logs are in MIDDLEWARE_HOME/user_projects/domains/domain name/servers/managed server name/logs.

Second, they have a batch, or shell script depending on the environment, that will zip all the needed logs into one file so you can easily provide all the detail for Oracle to be as efficient as possible in diagnosing my problem.

In the EPM_ORACLE_INSTANCE/bin folder, the ziplogs.bat (ziplogs.sh) script will create a zip file with all the logs for me, and place the zip in EPM_ORACLE_INSTANCE/diagnostics/ziplogs.

Now, there is one file per server with the appropriate collection of logs, configuration files, and other pertinent info that the help desk can use.


Increased Efficiency Utilizing Saved Objects in Financial Reporting

All developers understand the power of using objects during development activities, a concept that can be leveraged in the development of Oracle/Hyperion Financial Reports. Utilizing saved objects allows the development team to deliver a product in less time and provides the ability to quickly react to future report modifications. The information below (1) provides common saved object examples and (2) displays how saved objects are created and used.

What type of report information should be converted into saved objects?

The goal behind utilizing saved objects is to avoid the recreation of code, thus I find it valuable to turn all report header and footer information into saved objects. Items such as company logo’s, report title/sub-tile information, dimensional point-of-view selections, date & time stamps, page numbers and data source information make for great saved objects as they typically reside on all financial or management reports.

The usefulness of report objects may seem less important during the early stages of development, but as your reporting repository grows, their impact becomes increasingly important. For example, changing a company logo on a few reports is a minor incontinence, but making that same change to 50 reports could take hours to complete, resulting in the inefficient use of development/ maintenance time.

How are saved objects created and used?

Creating saved objects is a simple process that requires one additional step after the initial creation of your object. The example below walks through the process of creating a report title saved object. The same process will be used in the creation of all reporting saved objects.

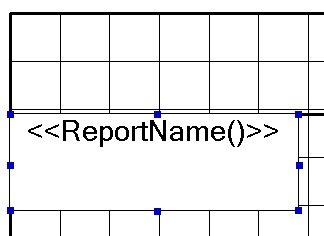
Step 1 – Create your Object:


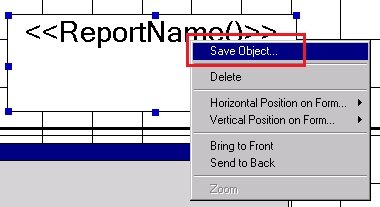
Step 2 – Save the Object:

Right-click the object and select Save Object…

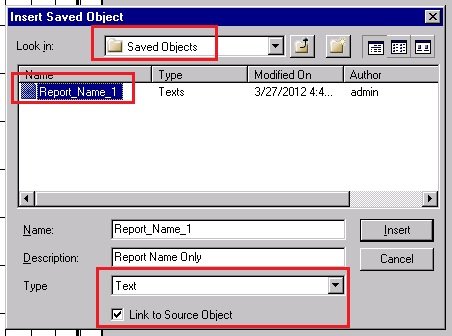
Best practice involves the creation of a Saved Object folder in the report repository where all saved objects will reside. Notice the use of this folder below.

IMPORTANT – Be sure to place a checkmark next to “Link to Source Object”. This link enables future modifications of this object to resonate across all reports where this object exists. This checkbox allows for the increased efficiency when developing and maintaining reports.

Once the report has been saved, notice the object name changes.


Step 3 – Use your Saved Object:

Once the object has been saved you can reference it in future report development via the link. Create a new report and insert the saved object.


Be sure to select the Type of “Text” (It will always default to Grid) and place a checkmark next to “Link to Source Object”. 

FYI: When inserting saved objects you have 4 choices (Grid, Text, Image and Chart). Be sure to select the correct type in order to locate the desired saved object.

Note that when saved objects are inserted, they are placed in the body of the report by default; the developer will need to place the saved object in the correct position on the report.


Managing More With Less Doesn’t Have To Be Impossible


We will always be asked to do more with less. Finance is asked to produce more and better analytics with less people. Sales people are asked to produce more in a weakening economy with less marketing dollars, and yes, groups that manage Essbase environments are asked to produce and manage more data/applications with shrinking resources.

Back in the Day

In a prior life, I used to manage a group responsible for managing the Essbase environment used to produce all the reporting for the group. It generated about 70% of the revenue for Bank One (now Chase). We delivered all the reporting, budgeting, and forecasting applications. It included nearly 2 TB of data (pre ASO) on four servers that included more than 50 databases. All the typical technologies were employed. A large number of filters existed to maintain security. Many of the applications were linked together with several types of partitions. Data was loaded daily, weekly, and monthly. SQL Server was used for all the ETL processes, and we completed the development and performed all the maintenance with four people.

The only way the group could be effective in developing and enhancing applications, was to eliminate our effort spent on typical production activities. With the number of applications and the frequency they were updated (daily, weekly, or monthly), communicating this information to the more than 250 users was also a large time commitment.

The Solution

We built custom applications using the Essbase API to not only automate the tasks, but also notify the appropriate person if there was an error. This included everything from data loads, application builds, ETL processing, nightly data exports, repetitive calculations, and every other aspect of the maintenance. We even automated the validation of the data during the load process. Data loaded to the ETL layer was compared to the ETL Export. After the data was loaded to the Essbase application, we automated Excel data retrieves and compared them back to the ETL data exports. We effectively eliminated any effort it took to maintain the environment unless an error occurred that required attention. This was the ONLY way we could keep our heads above water.

We chose the API because it is so robust. It has most of the Maxl functions. It introduces the ability to check for errors at any point in the process, and can take the appropriate steps to resolve. No manual intervention was required. The same application can interact with the ETL layer, send text messages or pages, email administrators and users, and update web pages with statuses that the users can see (like the state of the load process, calculation status, etc.).

This solution may be overkill for very small implementations of one or two applications. But, don’t underestimate its importance in medium to large-scale operations. It minimizes costs, reduces errors, provides a better user experience, and minimizes delays in new development.

I highly recommend investigating how this would work for your group. Although I used the Visual Basic API, there are also libraries for C and Java.


Is Your Message Getting Ignored?

Think about how many emails you delete without reading. Your inbox gets cluttered with specials from your favorite stores that you requested to be sent.  You just but didn’t realize a new email would show up every other day. Everyone has the friend who sends emails that he or she thinks is so funny that aren’t. There’s also the person who seems to update his status multiple times a day and “checks in” at the grocery store, work, dinner, etc. Sometimes it’s your system administrator sending you updates about every aspect of the system that you delete. Then you think, Wait, I am the administrator. My emails are always read!  Right?

Are You That Friend?

Well, I hate to tell you, but to your users, you may be the “that” friend. You may be the one telling them what time you woke up, when you got to work, and where you ate dinner.  You may be on the dreaded auto delete list.  Your email might be the email that triggers the twitch and the water cooler comments.  The big question is, What happens to that one important email out of the 20 you send?

How To Remove Yourself From The Auto-Ignore List

If you are a system administrator, it’s critical that you filter the information to your users to minimize the irrelevant communication.  Not all your users require the same information.  Here are some suggestions that may improve your communication and limit the frustration of your user population.

  1. Only send out global communications when it is appropriate.  If only one of your servers will be impacted, make sure only the users that will be impacted are notified.
  2. If you have more than one application, create a distribution list for each one.  This will ensure that relevant information is sent to the appropriate users.
  3. If you have users with different responsibilities, make sure you separate those responsibilities.  If information is sent out about when the system will be open to change a budget or forecast, only inform those that have the ability to make those changes.
  4. Let your users choose what they are notified about.  If you have a list of topics that are typically communicated, let your users decide which email groups they associated with.

When developing this methodology, use careful consideration about your approach.  For environments including only a few applications and a small population of users, don’t try a multi-tiered solution.  A spreadsheet would likely meet your needs.  For environments that are larger, think about the implications of managing these lists with a lot of applications and hundreds of users. Managing offline lists could become a job in itself, and become outdated and useless over a short period of time.

A Thought

Prior to consulting, I managed a fairly large environment.  We had more than 250 users and 10 to 20 applications.  They ranged from field headcount reporting, to home office budgeting and forecasting.  The approach I used was not complicated, it was easy to setup, and it gave the users all the control in deciding what they received.  A relational database was created to hold the distribution lists, users, and their emails.  Users could access this from a website (one asp/.net web page) that allowed them to enter their email, return the topic groups they are associated with, and allow them to change it in real-time.  Any time a new distribution group was added, a global email was sent out notifying everyone of the addition.  Email distributors (in our case, the system administrators), could use this website to send out emails by selecting which groups should be notified.

Happy Customers

This approach above took less than a day to create.  It significantly reduced the frustration from the user population. They only received emails they wanted to receive, they were aware of the different types of communication, and THEY controlled the amount of communication they received.  By empowering them, critical information was far less overlooked.


Why is my database growing? It’s killing my calc times!

There are times when planning and forecasting databases grow for apparently no reason at all. The static data (YTD actuals) that is loaded hasn’t changed and the users say they aren’t doing anything different.

If you load budgets or forecasts to Essbase, you probably do what I’m about to tell you. If you are a systems administrator and have never seen how finance does a budget or forecast, this might be an education.

The culprit?  More data!

Budgets and forecasts are not always completed at the bottom of the hierarchy and rolled up. I don’t mean technically, as you might be thinking, Yes they do, they load to level 0 members and it gets consolidated up the outline. When it comes to budgets and forecasts, they are largely done in a top down approach. What this means is that finance is given a goal, or number, they have to hit, and they have to PUSH it down to lower business groups. The way a financial analyst creates a top-down budget, many times, is to allocate a value based on a metric, like headcount or sales.

Assume a budget for desktop support services is required. Let’s say management has mandated that the expense doesn’t grow from last year. Since this cost is to support the people in the business, the expense is divided by the expected headcount and allocated evenly. If a business unit has 20% of the people, that unit will get 20% of the expense. Since the expense to be allocated isn’t going to change, but the headcount will, the following will be the result:

Because the analyst doesn’t want to worry about missing any changes to the headcount forecast, he or she will create a data retrieve with headcount for every cost center, whether it has headcount or not. A lock and send sheet now takes the percentage of headcount each cost center has and multiplies that factor by the total expense. As headcount gets re-forecasted, this expense has to be reallocated. With this methodology, all the user has to do is retrieve the sheet with all the headcount forecast. The math does the allocation and the result is sent back to the database.

Easy, right?

This makes a ton of sense for an accurate forecast or budget with minimal effort. Not so fast, as this has two major flaws.

First, the volume of data loaded may be drastically higher than it needs to be. Assume the worksheet has 500 cost centers (500 rows). If half of these have no headcount, there are an additional 250 blocks created that hold zeros (assuming the cost center/organization hierarchy is sparse). This method, although very efficient for updating the numbers for the analyst when headcount changes, is causing the database to grow substantially. In this isolated example, there is twice as much data than is required.

Secondly, since the data has to be loaded at level 0, the analyst thinks loading at every cost center is a requirement. The materiality of the data at this level is often irrelevant. Let’s say that the analyst is really forecasting at the region, but loading data at the cost center because it is required to be loaded at level 0. Assume there are 10 regions in which these 500 cost centers exist. A forecast at the 250 cost centers that have headcount is not required. The forecast only needs to be loaded for 10 cost centers, one for each region. If this method were used, we would only create 10 blocks, rather than the 250, or 500 originally. When the system has hundreds of users, and thousands of accounts, you can see how the size of the database would grow substantially. This also provides no additional value and huge performance problems. In the example above, the number of blocks can be reduced from 500 to 10. It is far quicker to calculate 10 blocks than 500.

Even if the data needs to be at the cost center, many times the allocation is so small, the result of the allocation is pennies, or dollars. You would be hard-pressed to find a budget where a few dollars is material. In situations like this, the users have to ask themselves if the detail is worth the performance impact.

Users, Help Yourselves

Educate your users and co-workers on the impacts of performing these types of allocations. If loading data at every cost center is required, change your formula. Rather than calculating the expense as

=headcount / total headcount * Total Expense

add an IF statement so when the retrieve has no headcount, the calculation produces a #MI,

rather than a 0. This would be more efficient

=IF(headcount=0,”#MI”, headcount / total headcount * Total Expense)

If this is not necessary, change the way the data is loaded. Rather than picking all the cost centers, retrieve the headcount from the regions and build the send template to load to one cost center for each region.

The Real World

I worked for a large financial institution with a 100 Billion dollar budget. More than 70% of all the data was less than 10 dollars, and 30% was equal to zero! The budget was never looked at below region, which was 4 levels deep in an organization hierarchy that included more than 30,000 cost centers.

After consolidating the insignificant data and educating the users, the calc times decreased from 50 minutes to less than 5. All aspects of performance were better.

Easily Find Out How This is Impacting Your Application

There are a lot of ways to see if this phenomenon impacts your database. If the database is small, the export could be loaded to Excel. With some basic IF statements, the number of cells that were higher or lower than an identified threshold could be determined. Because I regularly work in a lot of different environments with large amounts of data, I wrote an application to traverse through an Essbase export to produce statistics on the data. The application is attached for download. Make sure you have the .NET libraries installed or this will not execute.  Version 3.5 or higher is required, and can be found by searching download .net framework.  There is a good chance it is already installed.

This is a simple application that I developed quickly to help me understand the degree to which a database is impacted by the example explained above. It will traverse through roughly 25,000 lines every second, and will provide the following metrics:

  • the number and percentage of values above a threshold entered
  • the number and percentage of values below a threshold entered
  • the number and percentage of values that are 0
  • the number and percentage of values that are #Missing, or Null
  • The number of lines in the export and the number of seconds it took to process

To use this, export the database at level 0 and choose column format. You will be prompted for the path and file name of the export, and the threshold to evaluate.

Download Essbase Export Analysis, and give it a try.


Creating Row and Column Templates

When developing it’s always best to avoid “recreating the wheel” and the same concept applies when building reports in Hyperion Financial Reporting. An important step in the design phase centers on report row and column sets; these are simply the groups of members which display in the rows and columns of each report. Any reports that “share” groups of members, whether in rows or columns, provide an excellent opportunity for creating Hyperion Row and/or Column Templates. These templates can then be referenced in additional reports, resulting in decreased development effort and less maintenance.

Benefits: When needing to create multiple reports which have similar or identical row and column sets, the user can save time by creating one standardized row and column set, saving it as an object in the repository, and reusing it for multiple reports.  The user also has the ability to modify a row/column template at any point and resave it into the repository which automatically updates all grids linked to the template.  
Creating Row & Column Templates
The building of Row and Column templates starts with building the “row set” or “column set” in a report grid. You use the FR Client to build row and column templates just as you would build FR reports. The example below will walk through creating a row template keeping in mind that the same steps will be taken to create a column template.

Step 1: Create a new FR report (using the Account Dimension for rows in my example).

Step 2: Highlight the members that make up the row set.
You can select any row (or combination of rows) to create the Row Template. Be sure you highlight the entire row as shown in the image below.

Step 3: Build the Row Template. (Screen shot images below)
Once you have highlighted the intended set of rows, select “File->Save Object…”. You will notice once you highlight the rows and decide to save an object; the “File Type” will default to “Row and Column Template”.

*Note that you should deselect the option for “Link to Source Object”. When you create the template this option is not necessary. You will select this option later when referencing the object in reports.

You will be asked to make selections for Suppression, Row Height, Column Width and Page Break options.

  • Suppression – you can save or inherit any application of suppression (that is, if zero, missing, or error) within the rows and columns selected.
  • Row Height – if you selected a row for your template, you can save or inherit any application of row height, which can be changed manually or numerically from the Row Height text box on the Row Properties property sheet, within the selected rows and columns.
  • Column Width – if you selected a column for your template, you can save or inherit any application of column width, which can be changed manually or numerically from the Column Width text box on the Column Properties property sheet, within the selected rows and columns.
  • Page Breaks – you can save or discard page breaks specified within the rows and columns selected.

Once you have made your selections, click OK. This completes the Row Template build process. Note that you don’t have to save the report which was just created – you can just choose to close it. The Row Template will have saved.

Adding Row & Column Templates to a Report
Once the Row Template has been created it can be referenced in any report – making sure that the Row Dimension(s) are the same as that in the Row Template. The steps below walk through pulling the Row Template into a report. *Note that the report which will contain the linked Row Template can also include additional data, formula, or text rows.

One requirement for adding the Row Template into the report is the addition of at least one data row. This data row can be hidden on your report, but Hyperion FR requires a minimum of one data row in addition to your Row Template.

Step 1: Inserting the Row Template
To add the Row Template, highlight the row below row 1, right-click and select “Insert Row and Column Template”.

Navigate to and select the needed Row Template. Be sure the check box for “Link to Source Object” is selected. Click “Insert”.

Notice that the Row Template has been added (identified by the yellow cells). You will need to save this report. When the report is run you will now see all rows from the Row Template linked to the report.

Modifying the Row & Column Template
In order to modify an existing Row Template you must open a report which references the Row Template. Note that you cannot open the actual Row & Column Template; it will result in an error message.

Step 1: Open a Report that references the Row Template

Step 2: Unlink the Source Object
To unlink the source object you must first highlight the Row Template rows on the report. You will be prompted to verify that you want to “Unlink the Object”… select “Yes.”

Step 3: Modify the Report
Make any necessary Row modifications such as adding Accounts or changing formatting.

Step 4: Re-Save the Object
Follow steps 2 and 3 from the “Creating Row & Column Templates” section above making sure to resave the template.  You will be prompted to verify if you want to “Overwrite the existing file”…select “Yes”. Once the modifications are finished and the Row Template is re-saved, any reports referencing that Row Template will automatically update.


Improving The User Experience with Global Rates


Almost every planning or forecasting application will have some type of allocation based on a driver or rate that is loaded at a global level.  Sometimes these rates are a textbook example of moving data from one department to another based on a driver, and sometimes they are far more complicated. Many times, whether it is an allocation, or a calculation, rates are entered (or loaded) at a higher level than the data it is being applied to.

A very simple example of this would be a tax rate.  In most situations, the tax rate is loaded globally and applied to all the departments and business units (as well as level 0 members of the other dimensions).  It may be loaded to “No Department”, “No Business Unit”, and a generic member in the other custom dimensions that exist.

If a user needs the tax rate, in the example above, they have to pull “No Department” and “No Business Unit.”  Typically, users don’t want to take different members in the dimension to get a rate that corresponds to the data (Total Department for taxes, and No Department for the rate).  They want to see the tax rate at Total Department, Total Business Unit, and everywhere in-between.

There are a number of ways to improve the experience for the user.  An effective solution is to have two members for each rate.  One is stored and one is dynamic.  There is no adverse effect on the number of blocks, or the block size.  The input members can be grouped in a hierarchy that is rarely accessed, and the dynamic member can be housed in a statistics hierarchy.

Using tax rate in the example above, create a “Tax Rate Input” member.  Add this to a hierarchy called “Rate Input Members”.  Any time data is loaded for the tax rate; it is loaded to Tax Rate Input, No Department, No Business Unit, etc.  Under the statistics/memo hierarchy, create a dynamic member called “Tax Rate”.  “Tax Rate” would be the member referenced in reports.  The formula for this includes a cross-dimensional reference to the “Tax Rate Input” member, and would look something like this.

“No Department”->”No Business Unit”->”Tax Rate Input”;

When a user retrieves “Tax Rate”, it always returns the rate that is loaded to “No Department,” “No Business Unit,” and “Tax Rate Input,” no matter what department or business unit the report is set to.  The effort involved in creating reports in Financial Reporting or Smart View now becomes easier!

There is an added bonus for the system administrators.  Any calculation that uses the rate (you know, the ones with multi-line cross-dimensional references to the rates) is a whole lot easier to write, and a whole lot easier to read because the cross-dimensional references no longer exist.

Before you move the application to production, make sure to set the input rates consolidation method to “Never.”  Don’t expect this change to make great improvements in performance, but it will cause the aggregations to ignore these members when consolidating the hierarchies.  A more important benefit is that users won’t be confused if they ever do look at the input rates at a rolled up level.  The ONLY time they would see the rate would be at level 0, and would be an accurate reflection of the rate.

Note:  It is recommended to create member names without spaces.  The examples above ignored this rule in an effort to create an article that is more readable.